







"Pure" Renko strategy
Hello everyone,
Do you remember my work on the RENKO ?
From this indicator, we will try a very simple strategy.
The simplest is the “PURE” Renko.
For the definition of the Renko, I refer you to other sites that explain it very well.
We go LONG if : we have 2 “bullish” Renko bricks in the same direction.
We go SHORT if : we have 2 “bearish” Renko bricks in the same direction.
So we are constantly on the market. We are just following the trend.
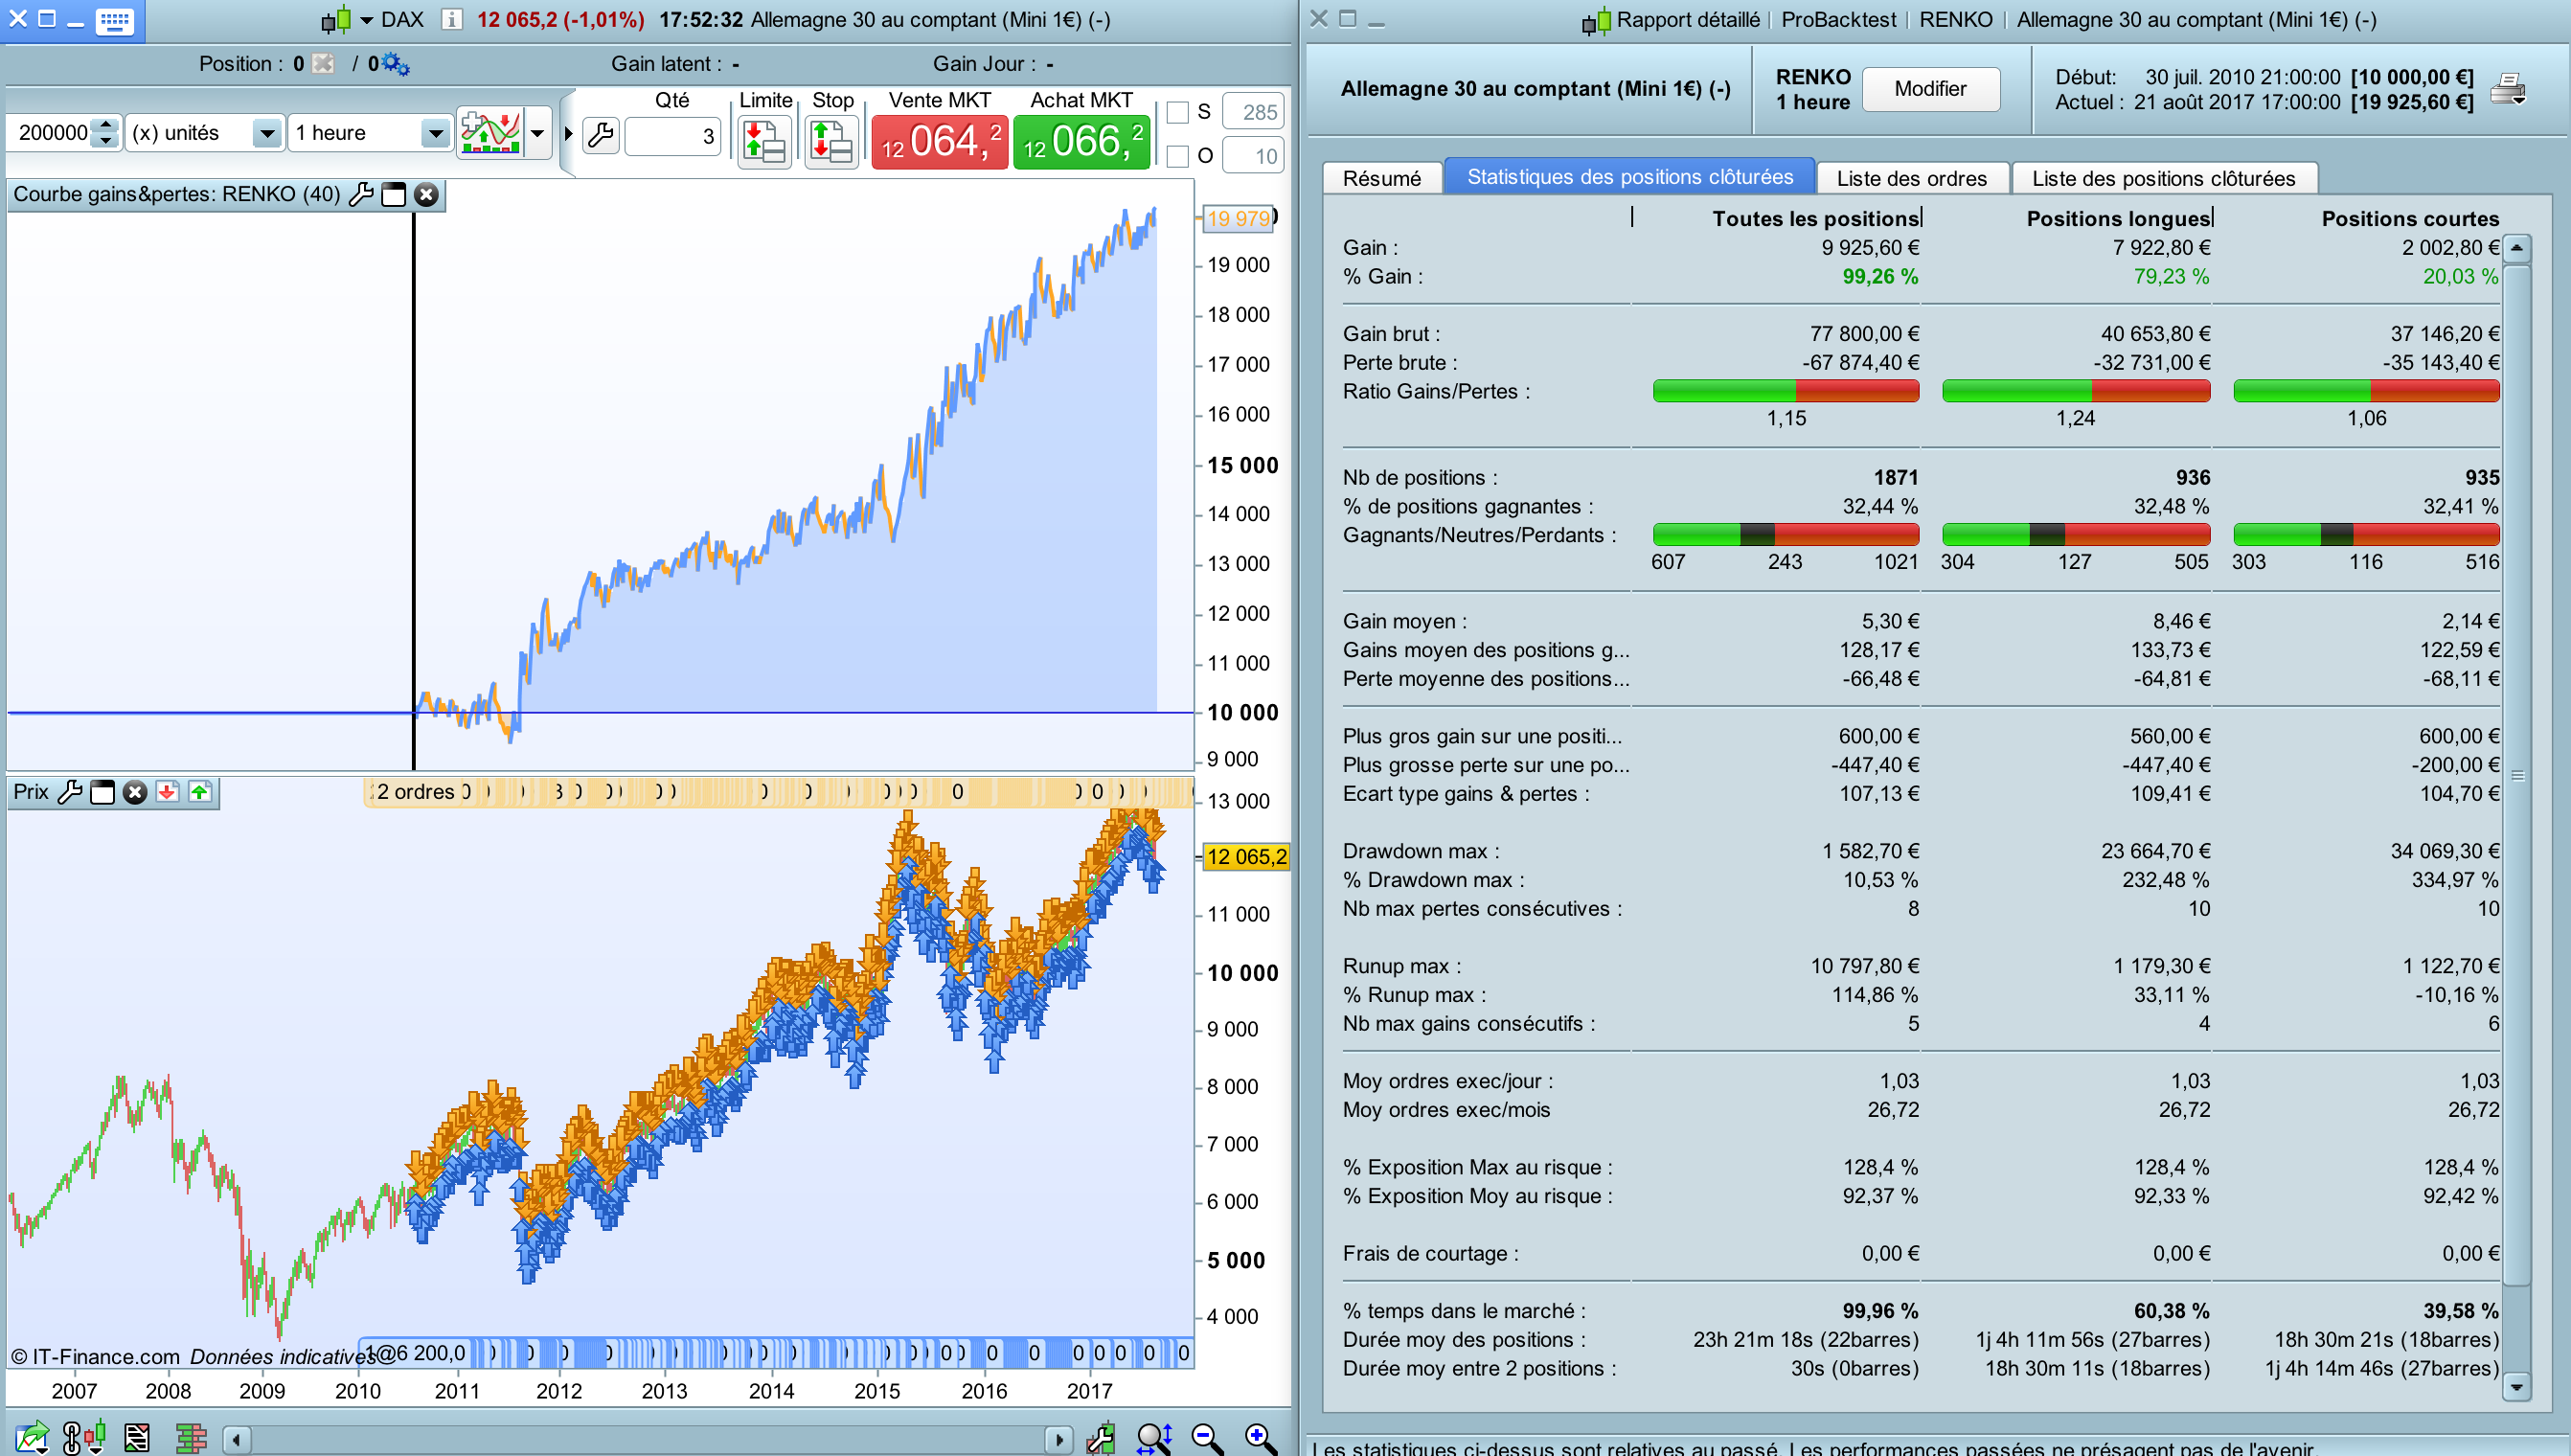
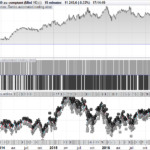
Here is the result of the backtest, on the DAX : H1 graphs (no matter, because the important thing is the size of the Renko bricks), Renko size : 40 points, Spread: 1 point, test “tick by tick”.
As you can see, the strategy is profitable. Low success rate, compensated by some highly winning trades.
I think there’s plenty of way for improving this strategy idea, adding refined entry rules, a breakeven, a trend filter, and so on.
And one can test this strategy on the forex with other sizes of bricks.
Here is the code (very simple, but the indicator words well also) :
Defparam cumulateorders = false

boxSize = 40

once renkoMax = ROUND(close / boxSize) * boxSize
once renkoMin = renkoMax - boxSize

IF high > renkoMax + boxSize THEN
 WHILE high > renkoMax + boxSize
  renkoMax = renkoMax + boxSize
  renkoMin = renkoMin + boxSize
 WEND

ELSIF low < renkoMin - boxSize THEN
 WHILE low < renkoMin - boxSize
  renkoMax = renkoMax - boxSize
  renkoMin = renkoMin - boxSize
 WEND
ENDIF

buy at renkoMax + boxSize stop
sellshort at renkoMin - boxSize stop
Comments
You must be logged in to post a comment.

My bad guys. I understood what was the problem. The indicator uses highs and lows for the Renko building. However, my Renko chart is built with closes. That explains the differences. The indicator give the same result as my chart replacing "high" and "low" by "close" in the code.
Good afternoon everyone. Thanks Doctrading for your work. I have an issue while using this code (as an indicator) to simulate renko bricks on candlestick chart. I don't have the exact same behaviour between the renko chart and the renko indicator. The number of green or red bricks on a movement is the same in approximately half of the time. My two charts have the same timeframe (only a few ticks in order to be more precise on the building of the bricks) and the same number of units displayed. So I don't understand why the two charts are not identical. Do you have an idea of what could explain the difference between true renko chart and renko indicator? Thank you for your help.



Bonjour. avez vous trouver une solution à ce code? merci

Hi, thanks for the introduction to Renko charts! I modified this slightly for the DJI - 13 box on a 5min chart, added a time frame for London and a $12 trailing stop. In the backtest it looks stellar - 75% wins, 2800% gain over 17 months - too good to be true! When I run it in demo it's a different story, mostly losses. Any idea why there's such a discrepancy between the backtest and the live action? Here's the code: // Definition of code parameters DEFPARAM CumulateOrders = False // Cumulating positions deactivated // The system will cancel all pending orders and close all positions at 0:00. No new ones will be allowed until after the "FLATBEFORE" time. DEFPARAM FLATBEFORE = 143000 // Cancel all pending orders and close all positions at the "FLATAFTER" time DEFPARAM FLATAFTER = 210000 boxSize = 13 once renkoMax = ROUND(close / boxSize) * boxSize once renkoMin = renkoMax - boxSize IF high > renkoMax + boxSize THEN WHILE high > renkoMax + boxSize renkoMax = renkoMax + boxSize renkoMin = renkoMin + boxSize WEND ELSIF low < renkoMin - boxSize THEN WHILE low < renkoMin - boxSize renkoMax = renkoMax - boxSize renkoMin = renkoMin - boxSize WEND ENDIF buy 1 CONTRACT at renkoMax + boxSize stop sellshort 1 CONTRACT at renkoMin - boxSize stop // Stops and targets SET STOP $TRAILING 12

Because you've curve fitted the parameters. Try to look for a stable range of box size/trailing stop values. You can do this by dragging the optimised backytest results to the desktop and then drag the data into excel. Bring/drag the gain column over to the far right, select "gain" and "boxsize" (optimised parameter) and then use a scatter chart. If the values are scattered all over the place it's unlikely to work but if you find a stable range of boxsize values that produce profits then it's likely that the volatility/boxsize can be varied a little and still be profitable. Choose a mid value.

Hi I use your strategy but i don't know how to implement position size to the code thanks for help

Hi, have you tested on the period 30 julay - 30 September 2015?

Running a single Renko strategy with a fixed box size is usually not a good idea, because the results depend extremely on 1. the box size, and 2. on the initial value of the first box. So, if Renko strategies should be useful, they must be used as statistical "grates", that is, using many combinations of box sizes and initial positions of the first box at the same time. Then it is possible to get good results over the sum of all parameter sets, and purely accidental results are avoided. In principle, this holds for all "optimized" (curve-fitted) strategies as well, but in Renko charts there is the additional complication of the exact value of the first box that determines the behavior of all the rest.

Has anyone tried this on Bitcoin GBP1? The results look amazing but every time mine tries to enter a trade it says insufficient funds with £10,000 in the account. Does anyone have any ideas? I am not sure if this strategy is taking a huge position?