

Optimization moving average crossing strategy with “machine learning”
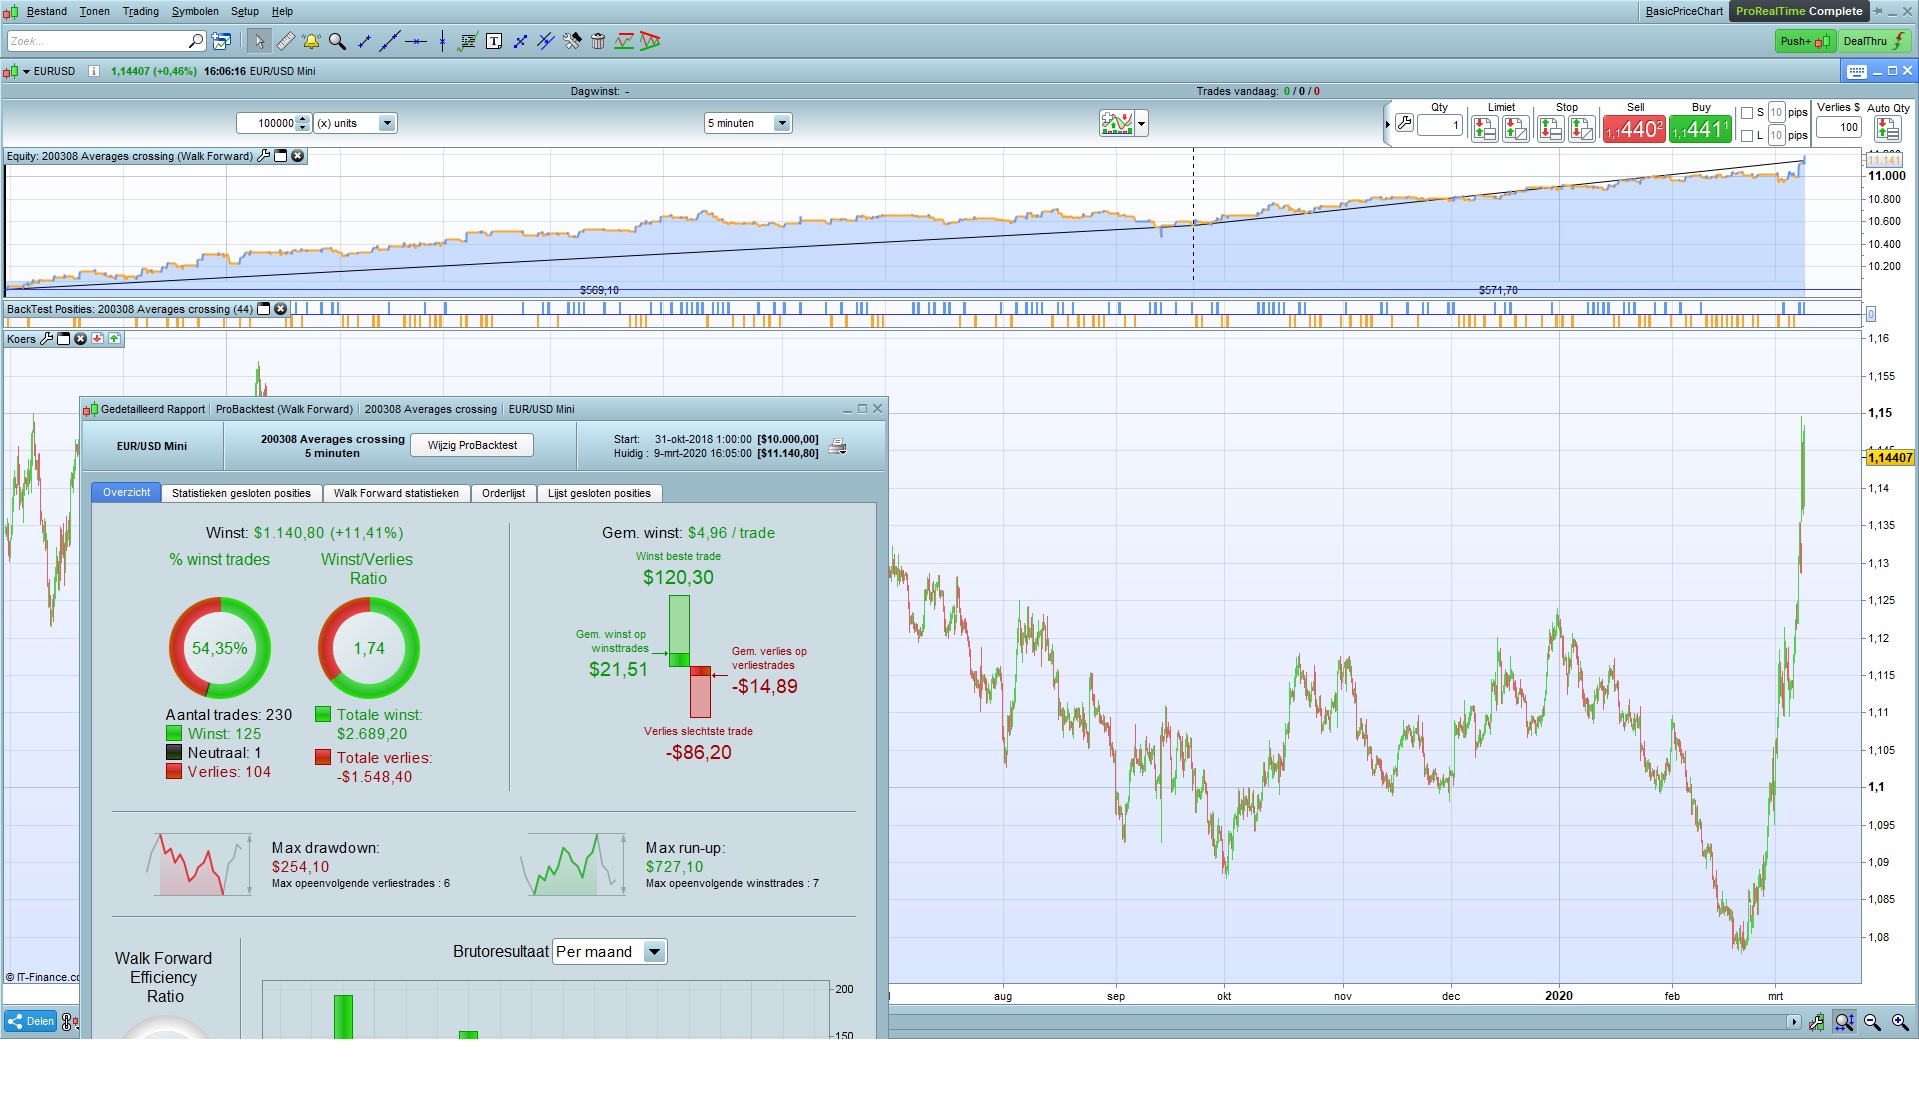
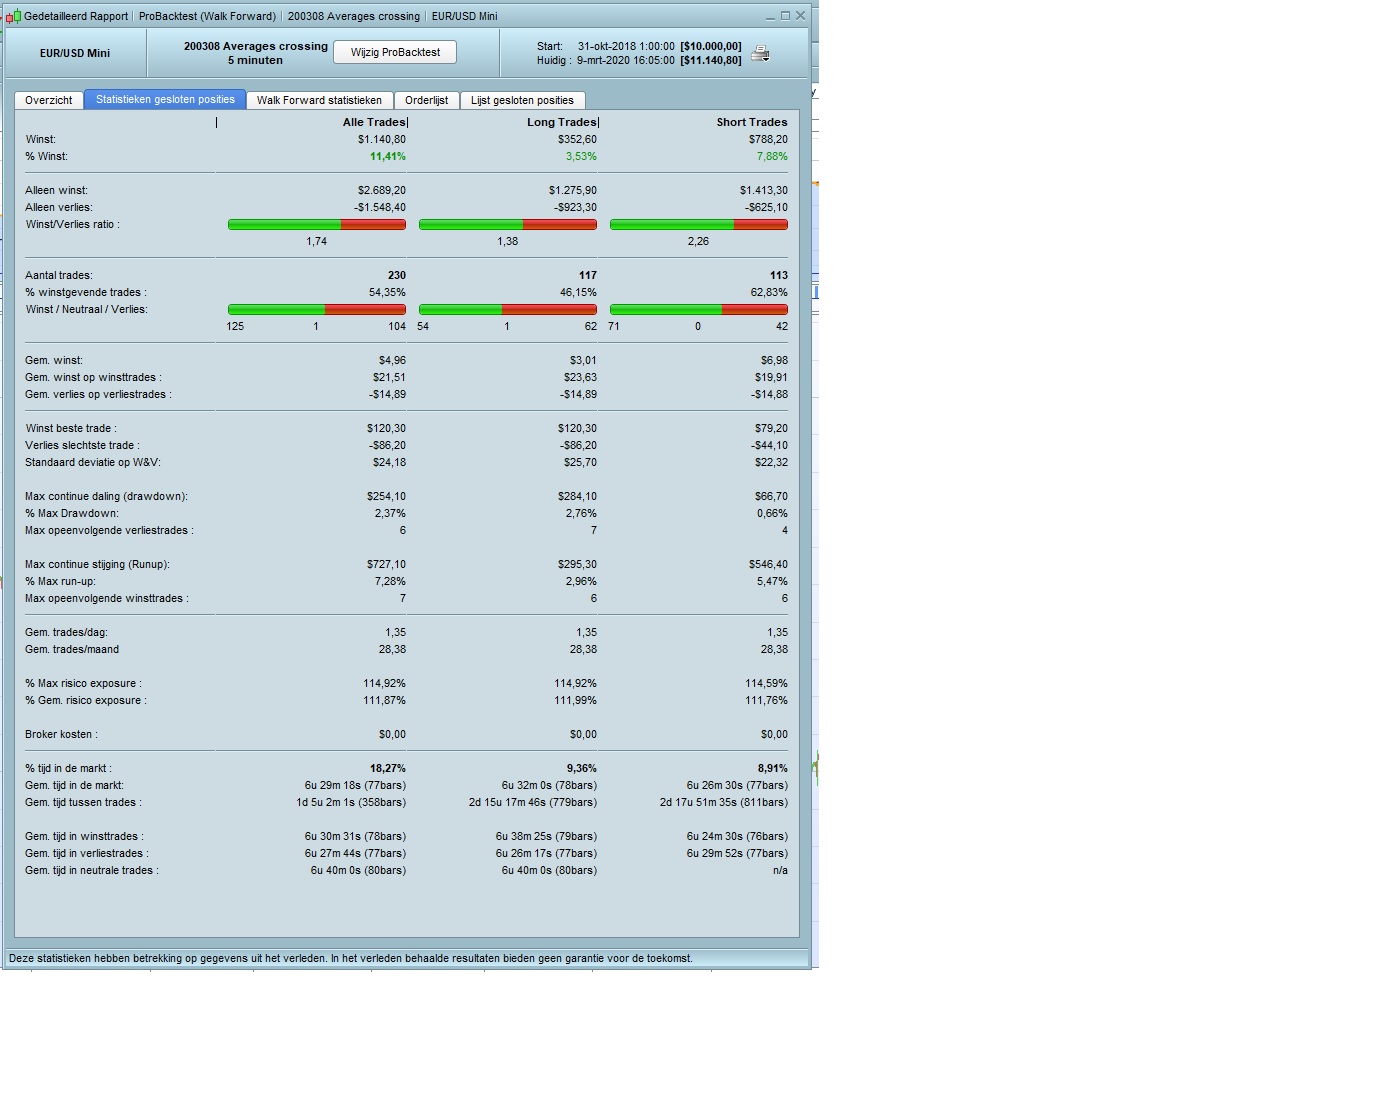
This is a “machine learning” strategy for finding the best crossing strategy, comparing 70 different averages with each other, given a certain time frame and a certain market.
(The source of the very most of the averages is https://www.prorealcode.com/prorealtime-indicators/average-filter-regression/ posted by Laurenzo in 2017)
The strategy is simple:
If the first average crosses above the second average, go buy long
and vice versa if the first average crosses under the second average, sell short
It can be used for currencies and indices, presumably also for stocks (non-daytrading)
This strategy determines which of the 70 different averages is to be crossed with which of the same 70 different averages to give the best result in a certain market in a certain time frame, what in my opinion can be seen as a kind of “machine learning”
Further added to this strategy: (up to the user to adjust those variables if wanted)
- to protect the position, a stop loss (TSL) is added (coded TSL = round(100/10000*close))
- exit a position every day at 16:00 hr (coded Defparam Flatafter = 160000) (Daytrading)
- limit to only one trade per day (coded OTD = Barindex – TradeIndex(1) > IntradayBarIndex, If using “TradeIndex(3)”, it would allow 2 opening trades per day, TradeIndex(5) would allow 3 trades per day, and so on.
- Opening trades only between 8:00 and 11:30, for American trades other times can be set.
There are 70 different types of averages, (listed below), which are used to cross each other (the first is named MAType, to be crossing the second MATypeV2)
To limit zigzagging of the averages due to market noise, an exponential average of 30 is added before the crossing condition is measured (Coded as wAFR = exponentialaverage[30](AFR) and wAFRv2 = exponentialaverage[30](AFRv2))
To limit the possibilities, the period is set for all average-types to 15 (Coded as Period = 15, Period2 = 15), periods may be adjusted.
Different stop distances can be used or a trailing stop can be used.
Be aware that if you use this “machine learning” on a small set of data, the outcome will be over- fitted and a different optimized set of averages for a different small set of data will appear (this happens with all strategies, robustness of the strategy has to be tested).
Be aware when running the given strategy, already 70 x 70 combinations has to be optimized, which is already 4.900 combinations, which makes the optimizing process (very) slow. It might be a good idea to split the combination into 5 sets, lets say from 0 to 13 averages comparing to the 69 averages, and next 14 to 26 comparing to 69 averages, and so on, then taking the best from the 5 sets.
I run the code first without In Sample/Out of Sample, to find the top 10 best average combinations, and around those top 10 run several In Sample/Out of Sample optimizations.
For In Sample/Out of Sample optimizations use 66% IS and 34% OOS, non repeated (not five runs)
The code is extremely long (> 3.600 lines), due to defining 70 and 70 different averages. Maybe it can be coded shorter ?
The crossing strategy itself can be found at the last rows !
I was not aware that PRT allows more then 3.600 lines of code as a strategy!
- Ahrens Moving Average
1. Adjustable Lag FIR
2. Arnaud Legoux Moving Average
3. 2-Pole Butterworth Smoothing Filter
4. 3-Pole Butterworth Smoothing Filter
5. Corrected Moving Average by A.Uhl
6. d9 Unscented Kalman Filter (Responsiveness Version)
7. d9 Unscented Kalman Filter
8. Double Exponential Moving Average
9. Exponential Least Square Moving Average
10. Exponential Moving Average
11. Elastic Volume Weighted Moving Average
12. Fast Adaptive Trend Line
13. Fractional-Bar Quick Moving Average
14. Fractal Adaptive Moving Average
15. Generalized DEMA
16. 1-Pole Gaussian Filter
17. 2-Pole Gaussian Filter
18. 3-Pole Gaussian Filter
19. 4-Pole Gaussian Filter
20. Hull Moving Average
21. IE/2 Combination of LSMA and ILRS
22. Integral of Linear Regression Slope
23. iTrend by John Ehlers
24. Jurik Moving Average (Responsiveness Version)
25. Jurik Moving Average
26. Kaufman Adaptive Moving Average
27. Kalman Filter by John Ehlers
28. Kalman Filter (Responsiveness Version)
29. Kalman Filter
30. Leader Exponential Moving Average
31. Laguerre Filter by John Ehlers
32. Least Square Moving Average
33. McGinley Dynamic
34. Middle High Low Range Moving Average
35. McNicholl Moving Average
36. Non Lag Moving Average (Responsiveness Version)
37. Non Lag Moving Average
38. One More Average
39. Pentuple Exponential Moving Average
40. Parabolic Weighted Moving Average
41. Quadruple Exponential Moving Average
42. Regularized EMA by Chris Satchwell
43. Reference Fast Trend Line
44. Reference Slow Trend Line
45. Slow Adaptive Trend Line
46. Simple Moving Average
47. 2-Pole Super Smoothing Filter
48. 3-Pole Super Smoothing Filter
49. Smoothed Simple Moving Average
50. Sine Weighted Moving Average
51. T3 Moving Average
52. Triple Exponential Moving Average
53. Triangular Moving Average
54. Time Series Average
55. Variable Index Dynamic Average
56. Variable Moving Average
57. Volume Weighted Average Price
58. Wilder Moving Average
59. Weighted Least Square Moving Average
60. Weighted Moving Average
61. Zero Lag BMT
62. Zero Lag Double Exponential Moving Average
63. Zero Lag FIR Filter
64. Zero Lag IIR Filter
65. Zero Lag John Ehlers
66. Zero Lag Weighted BMT
67. Range based AV high + STD – low – STD
68. Average highest [period] and lowest[period]
69 DEMA adjusted by itself
Please download the attached itf (200308-Averages-crossing.itf) to play around with this strategy.