

Heikin Ashi during trend
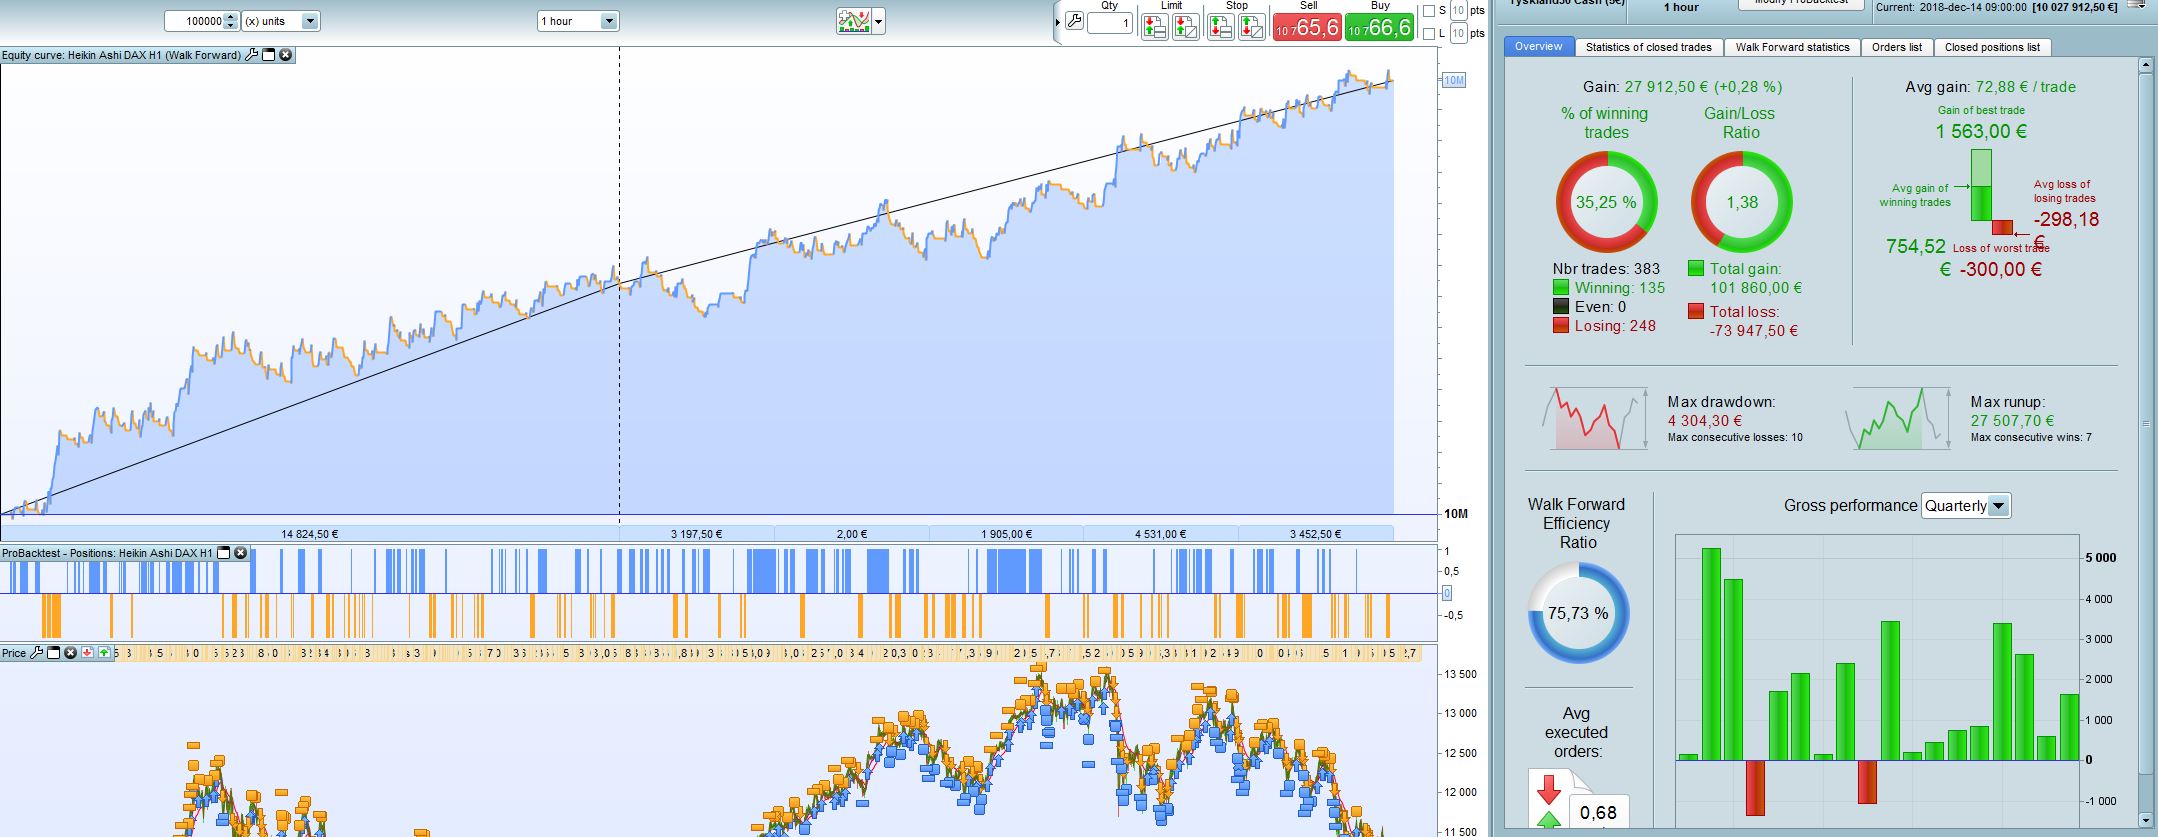
Hello,
This is one of my first strategies. It is a simple strategy with Heikin Ashi as a trigger during trends. It buys according to Heikin Ashi but only during uptrend set by EMA 25, 50 and 270. It sells acoording to HEikin ashi but only during trends (same EMA).
My question is of course if anyone have any improvement tips, but also my concenr for curve fitting and lack of robustness. I have tried to not make to many adjustments and I did my settings on about 28 months IS and then added another 7 months as OOS. The strategy works on DAX H1 and I didnt find any other markjet that worked well. I had the spread set to 2 for this backtest.
Please let me know your thoughts.
(please download the attached file to get all necessary codes).
//DAX H1 Heikin Ashi
Defparam cumulateorders = false

rangestart = 090000
rangeend = 170000

n = 1
Takeprofit = 150
Stoploss = 60

C3 = ExponentialAverage[25](close)//BLACK
C4 = ExponentialAverage[50](close)//RED
C5 = ExponentialAverage[270](close)//RED
indicator1 = CALL "Heiken Ashi"
c1 = (indicator1 = -1)
c2 = (indicator1 = 1)

IF time > rangestart AND time < rangeend AND c2 AND C4 > C5 AND C3 > C4 THEN
 BUY n shares AT MARKET
 Set target pprofit Takeprofit
 SET STOP pLOSS Stoploss
Else
 If time > rangestart AND time < rangeend AND c1 AND C4 < C5 AND C3 < C4 THEN
  Sellshort n shares at market
  Set target pprofit Takeprofit
  SET STOP pLOSS Stoploss
 ENDIF
endif