

Volatility Compression Breakout Screener
February 6, 2024, 1:19 PM
Screeners
0 Comments
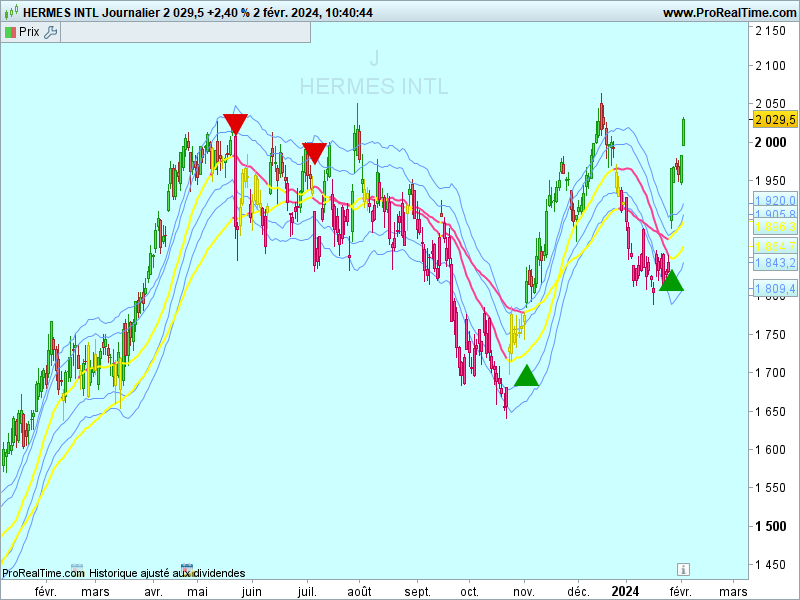
The Volatility Compression Breakout screener is designed to identify periods of low volatility followed by potential market breakout opportunities. It aims to capture moments when the price consolidates within a narrow range, indicating a decrease in volatility, and anticipates a subsequent expansion in price movement. This indicator can be applied to any financial instrument and period.
You can also use the indicator to display the breakout on your price chart: VOLATILITY COMPRESSION BREAKOUT
compressionPeriod =20
compressionMultiplier = 1.5
emaPeriod = 50
signal=0
atr =AverageTrueRange[14]
keltnerMiddle = KeltnerBandCenter[compressionPeriod]
keltnerUpper = keltnerMiddle + (compressionMultiplier * atr)
keltnerLower = keltnerMiddle - (compressionMultiplier * atr)
// Calculer l'écart type
stdDev = STD[compressionPeriod](close)
// Calculer le filtre de tendance
ema = ExponentialAverage[emaPeriod](close)
// Déterminer les conditions de rupture
breakoutUp =(high > (keltnerUpper + stdDev)) and close > ema and close[1] <= ema[1]
breakoutDown = (low < (keltnerLower - stdDev)) and close < ema and close[1] >= ema[1]
// Tracer des formes de répartition
if breakoutUp THEN
signal=1
endif
if breakoutDown THEN
signal=2
endif

F=signal=1 or signal=2
SCREENER[F] (signal as "signal")
Download
Filename:
VOLAT-COMPRESS-BO-SCREENER.itf
Downloads:
174
Senior
Operating in the shadows, I hack problems one by one. My bio is currently encrypted by a complex algorithm. Decryption underway...
Author’s Profile
Loading...