

Solid Trendfollowing Stocks with Oversold Condition.
January 23, 2018, 11:18 AM
Screeners
1 Comment
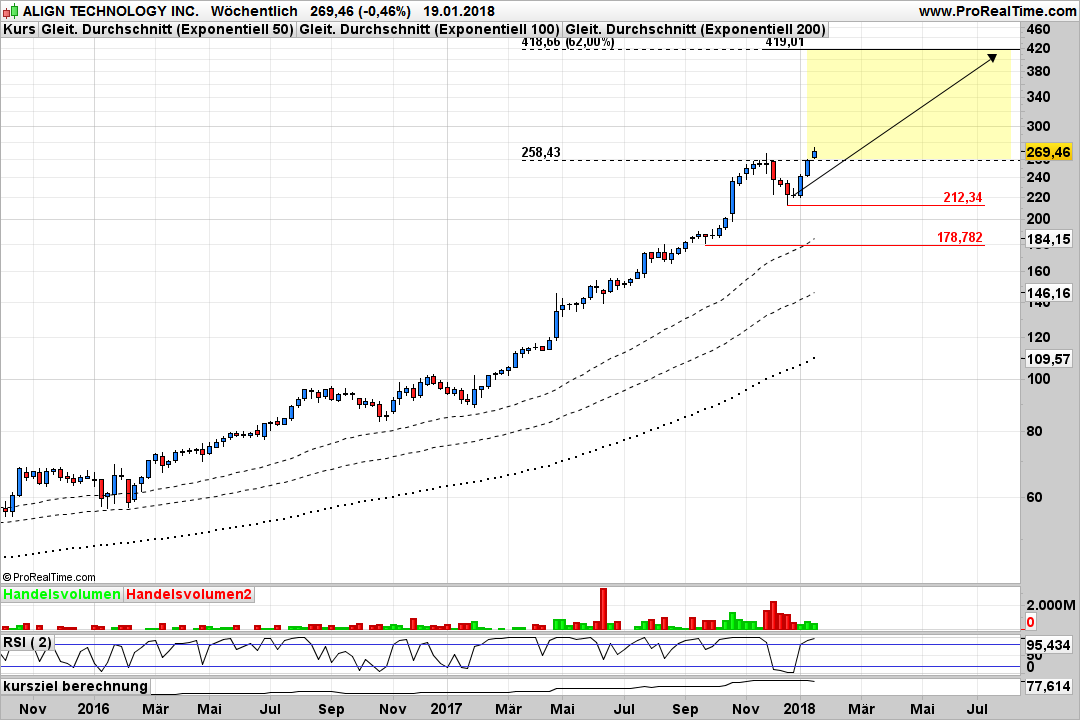
With this Screener you can find Stocks on Weekly Chart from 100 to 200 Weeks with a Stable Trend.
= System Quality Number ist over 2.5
And the RSI2 is under 10 – so you can find a great Entry in a strong UpTrend.
// Suche einen stabilen Trend von 100 Wochen bis 200 Wochen
ProfitSer = ROC[1](Close)
//Bar = Barindex - 1
ProfitSMA = Average[200](ProfitSer)
sqn = sqrt(100) * ProfitSMA / STD[100](ProfitSer)

ProfitSer1 = ROC[1](Close)
//Bar = Barindex - 1
ProfitSMA1 = Average[104](ProfitSer1)
sqn1 = sqrt(104) * ProfitSMA1 / STD[104](ProfitSer1)

ProfitSer2 = ROC[1](Close)
//Bar = Barindex - 1
ProfitSMA2 = Average[108](ProfitSer2)
sqn2 = sqrt(108) * ProfitSMA2 / STD[108](ProfitSer2)

ProfitSer3 = ROC[1](Close)
//Bar = Barindex - 1
ProfitSMA3 = Average[112](ProfitSer3)
sqn3 = sqrt(112) * ProfitSMA3 / STD[112](ProfitSer3)

ProfitSer4 = ROC[1](Close)
//Bar = Barindex - 1
ProfitSMA4 = Average[116](ProfitSer4)
sqn4 = sqrt(116) * ProfitSMA4 / STD[116](ProfitSer4)

ProfitSer5 = ROC[1](Close)
//Bar = Barindex - 1
ProfitSMA5 = Average[120](ProfitSer5)
sqn5 = sqrt(120) * ProfitSMA5 / STD[120](ProfitSer5)

ProfitSer6 = ROC[1](Close)
//Bar = Barindex - 1
ProfitSMA6 = Average[124](ProfitSer6)
sqn6 = sqrt(124) * ProfitSMA6 / STD[124](ProfitSer6)

ProfitSer7 = ROC[1](Close)
//Bar = Barindex - 1
ProfitSMA7 = Average[128](ProfitSer7)
sqn7 = sqrt(100) * ProfitSMA7 / STD[128](ProfitSer7)

ProfitSer8 = ROC[1](Close)
//Bar = Barindex - 1
ProfitSMA8 = Average[132](ProfitSer8)
sqn8 = sqrt(100) * ProfitSMA8 / STD[132](ProfitSer8)

ProfitSer9 = ROC[1](Close)
//Bar = Barindex - 1
ProfitSMA9 = Average[136](ProfitSer9)
sqn9 = sqrt(136) * ProfitSMA9 / STD[136](ProfitSer9)

ProfitSer10 = ROC[1](Close)
//Bar = Barindex - 1
ProfitSMA10 = Average[140](ProfitSer10)
sqn10 = sqrt(140) * ProfitSMA10 / STD[140](ProfitSer10)

ProfitSer11 = ROC[1](Close)
//Bar = Barindex - 1
ProfitSMA11 = Average[144](ProfitSer11)
sqn11 = sqrt(144) * ProfitSMA11 / STD[144](ProfitSer11)

ProfitSer12 = ROC[1](Close)
//Bar = Barindex - 1
ProfitSMA12 = Average[148](ProfitSer12)
sqn12 = sqrt(148) * ProfitSMA12 / STD[148](ProfitSer12)

ProfitSer13 = ROC[1](Close)
//Bar = Barindex - 1
ProfitSMA13 = Average[152](ProfitSer13)
sqn13 = sqrt(152) * ProfitSMA13 / STD[152](ProfitSer13)

ProfitSer14 = ROC[1](Close)
//Bar = Barindex - 1
ProfitSMA14 = Average[156](ProfitSer14)
sqn14 = sqrt(156) * ProfitSMA14 / STD[156](ProfitSer14)

ProfitSer15 = ROC[1](Close)
//Bar = Barindex - 1
ProfitSMA15 = Average[160](ProfitSer15)
sqn15 = sqrt(160) * ProfitSMA15 / STD[160](ProfitSer15)

ProfitSer16 = ROC[1](Close)
//Bar = Barindex - 1
ProfitSMA16 = Average[164](ProfitSer16)
sqn16 = sqrt(164) * ProfitSMA16 / STD[164](ProfitSer16)

ProfitSer17 = ROC[1](Close)
//Bar = Barindex - 1
ProfitSMA17 = Average[168](ProfitSer17)
sqn17 = sqrt(168) * ProfitSMA17 / STD[168](ProfitSer17)

ProfitSer18 = ROC[1](Close)
//Bar = Barindex - 1
ProfitSMA18 = Average[172](ProfitSer18)
sqn18 = sqrt(172) * ProfitSMA18 / STD[172](ProfitSer18)

ProfitSer19 = ROC[1](Close)
//Bar = Barindex - 1
ProfitSMA19 = Average[176](ProfitSer19)
sqn19 = sqrt(176) * ProfitSMA19 / STD[176](ProfitSer19)

ProfitSer20 = ROC[1](Close)
//Bar = Barindex - 1
ProfitSMA20 = Average[180](ProfitSer20)
sqn20 = sqrt(180) * ProfitSMA20 / STD[1180](ProfitSer20)

ProfitSer21 = ROC[1](Close)
//Bar = Barindex - 1
ProfitSMA21 = Average[184](ProfitSer21)
sqn21 = sqrt(184) * ProfitSMA21 / STD[184](ProfitSer21)

ProfitSer22 = ROC[1](Close)
//Bar = Barindex - 1
ProfitSMA22 = Average[188](ProfitSer22)
sqn22 = sqrt(188) * ProfitSMA22 / STD[188](ProfitSer22)

ProfitSer23 = ROC[1](Close)
//Bar = Barindex - 1
ProfitSMA23 = Average[192](ProfitSer23)
sqn23 = sqrt(192) * ProfitSMA23 / STD[192](ProfitSer23)

ProfitSer24 = ROC[1](Close)
//Bar = Barindex - 1
ProfitSMA24 = Average[196](ProfitSer24)
sqn24 = sqrt(196) * ProfitSMA24 / STD[196](ProfitSer24)

ProfitSer25 = ROC[1](Close)
//Bar = Barindex - 1
ProfitSMA25 = Average[200](ProfitSer12)
sqn25 = sqrt(200) * ProfitSMA25 / STD[200](ProfitSer25)
// 25 Variablen werden nach einem SQN über 2.5 abgetastet
c0 = sqn > 2.5
c1 = sqn1 > 2.5
c2 = sqn2 > 2.5
c3 = sqn3 > 2.5
c4 = sqn4 > 2.5
c5 = sqn5 > 2.5
c6 = sqn6 > 2.5
c7 = sqn7 > 2.5
c8 = sqn8 > 2.5
c9 = sqn9 > 2.5
c10 = sqn10 > 2.5
c11 = sqn11 > 2.5
c12 = sqn12 > 2.5
c13 = sqn13 > 2.5
c14 = sqn14 > 2.5
c15 = sqn15 > 2.5
c16 = sqn16 > 2.5
c17 = sqn17 > 2.5
c18 = sqn18 > 2.5
c19 = sqn19 > 2.5
c20 = sqn20 > 2.5
c21 = sqn21 > 2.5
c22 = sqn22 > 2.5
c23 = sqn23 > 2.5
c24 = sqn24 > 2.5
c25 = sqn25 > 2.5
// Einer der 25 Variablen musst über 2.5 liegen
c25 = c0 or c1 or c2 or c3 or c4 or c5 or c6 or c7 or c8 or c9 or c10 or c11 or c12 or c13 or c14 or c15 or c16 or c17 or c18 or c19 or c20 or c21 or c22 or c23 or c24 or c25
// Penny Stock Filter
c26 = close > 5.0
// Ausverkauf
c27 = RSI[2](close) < 10
//Ausverkauf muss heute oder gestern stattgefunden haben
// Volumenfilter 3 Mio Handelsvolumen  eines S-Dax Wertes
c29 = ExponentialAverage[52](volume*close) > 3000000


SCREENER[c25 and c26 and c27 and c29] sort by volume*close
Download
Filename:
TrendFollowing-stocks-oversold.itf
Downloads:
663
Veteran
secundary school-education to banker staff-multiple host part time - economist partime like: reading-thinking biases and chess.
Author’s Profile
Loading...