

Ichimoku screener for bullish signs
July 15, 2020, 1:08 PM
Screeners
0 Comments
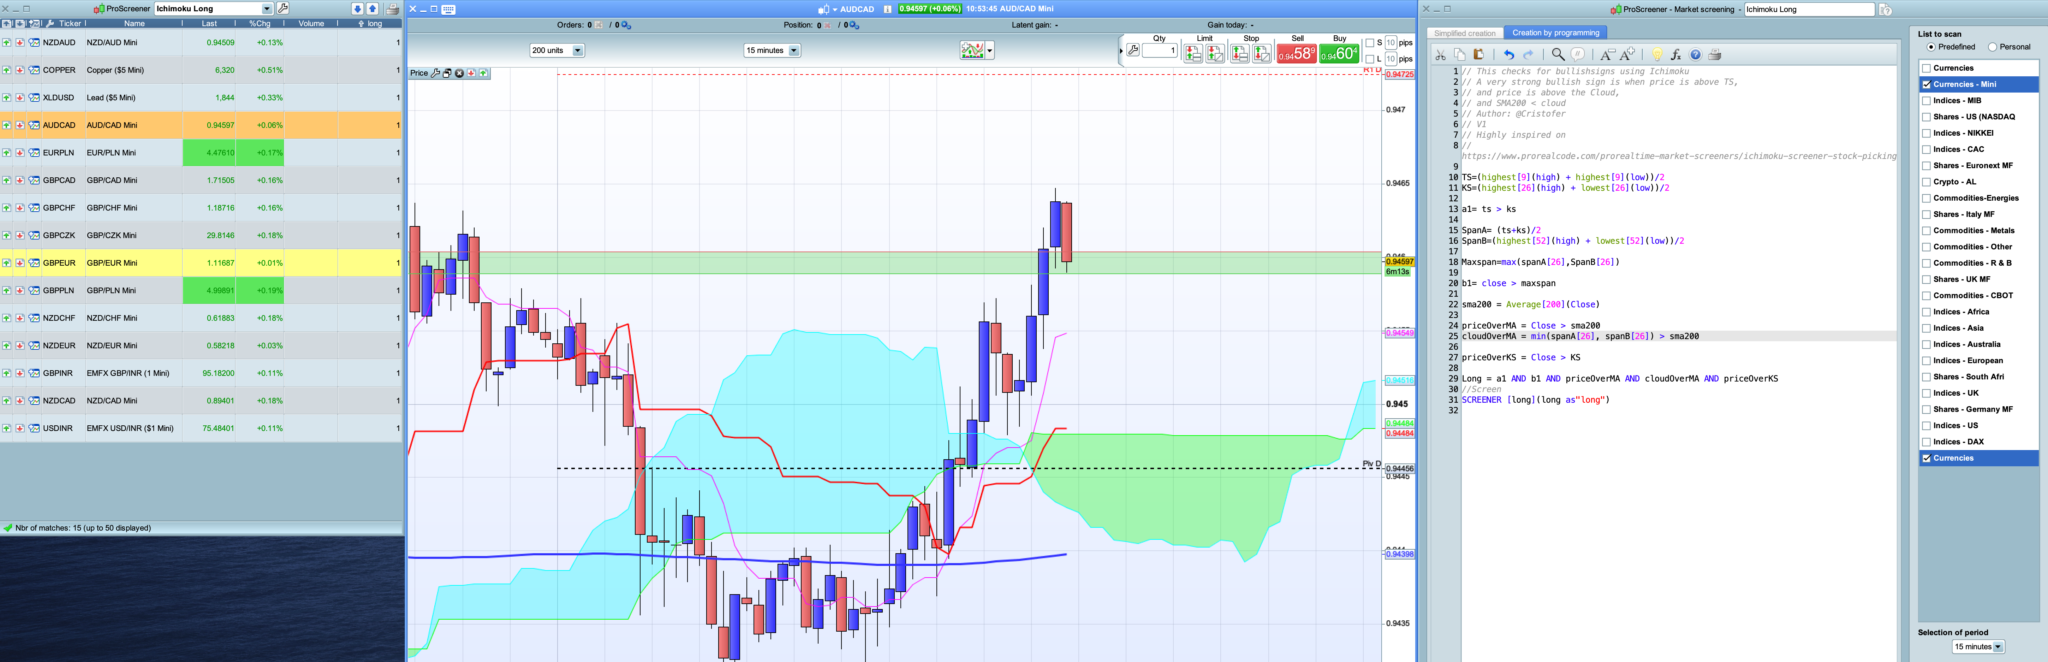
This checks for bullishsigns using Ichimoku
A very strong bullish sign is when price is above TS and price is above the Cloud, and SMA200 inferior to the cloud
// This checks for bullishsigns using Ichimoku
// A very strong bullish sign is when price is above TS,
// and price is above the Cloud,
// and SMA200 < cloud
// Author: @Cristofer
// V1
// Highly inspired on
// https://www.prorealcode.com/prorealtime-market-screeners/ichimoku-screener-stock-picking-for-long-orders/

TS=(highest[9](high) + highest[9](low))/2
KS=(highest[26](high) + lowest[26](low))/2

a1= ts > ks

SpanA= (ts+ks)/2
SpanB=(highest[52](high) + lowest[52](low))/2

Maxspan=max(spanA[26],SpanB[26])

b1= close > maxspan

sma200 = Average[200](Close)

priceOverMA = Close > sma200
cloudOverMA = min(spanA[26], spanB[26]) > sma200

priceOverKS = Close > KS

Long = a1 AND b1 AND priceOverMA AND cloudOverMA AND priceOverKS
//Screen
SCREENER [long](long as"long")
Download
Filename:
Ichimoku-bullish-signs.itf
Downloads:
410
Average
Operating in the shadows, I hack problems one by one. My bio is currently encrypted by a complex algorithm. Decryption underway...
Author’s Profile
Loading...