

Flag stock screener (volume spike and sharp move)
October 22, 2020, 12:28 PM
Screeners
6 Comments
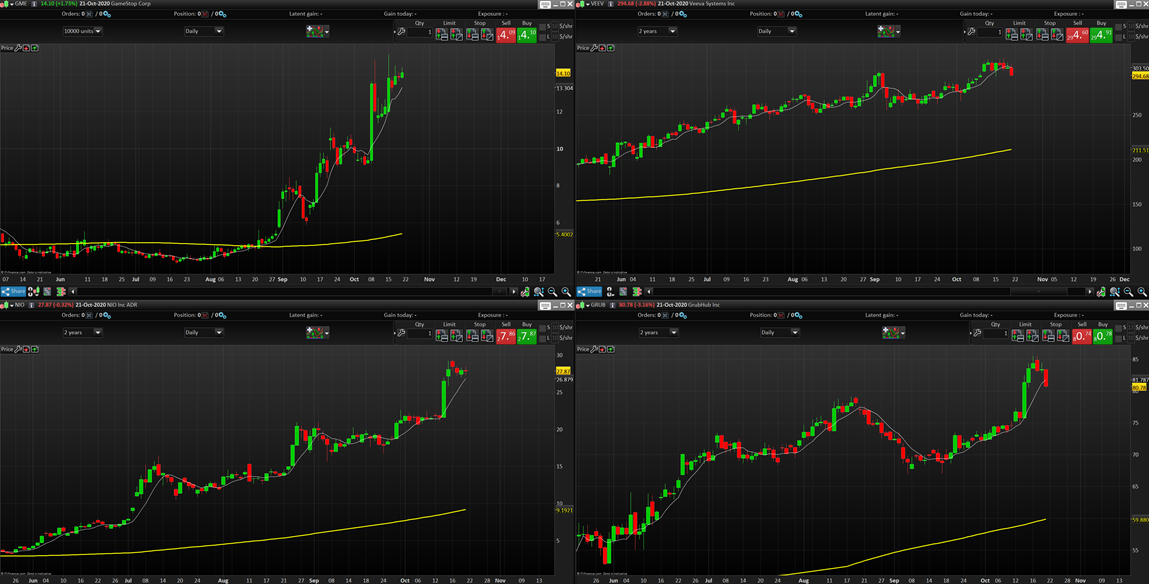
This flag consolidation setup stock screener will help you find with ease good potential entry points for long setup for stocks which have made a recent Volume spike and a sharp move.
Here is how it has been formulated:
- there was a breakout of Volume over its 20 periods average in the last 10 days
- the squared percentage of the price Close minus the 7 periods average made a breakout over its 200 periods average + 80% of its standard deviation
- the SMA 7 is over the SMA 200 and price Close is over the SMA 200
- the current candlestick High is below the highest high of the last 3 periods
This stock screener had been developed following a request in the screener forum:
https://www.prorealcode.com/topic/screener-for-stock-trading-flags/
//PRC_Flag stock screener | screener
//22.10.2020
//Nicolas @ www.prorealcode.com
//Sharing ProRealTime knowledge

c1 = summation[10](volume crosses over average[20](volume))>0
a = summation[3](close-average[7]/average[7])
diff = square(a-a[1])
avg = average[200](diff)+std[200](diff)*.8
c2 = summation[10](diff crosses over avg)>0
c3 = average[7]>average[200] and close>average[200]
c4 = high<highest[3](high)

c = c1 and c2 and c3 and c4

screener[c]
Download
Filename:
PRC_Flag-stock-screener.itf
Downloads:
443
Legend
I created ProRealCode because I believe in the power of shared knowledge. I spend my time coding new tools and helping members solve complex problems.
If you are stuck on a code or need a fresh perspective on a strategy, I am always willing to help. Welcome to the community!
Author’s Profile
Loading...