







Fibonacci 61.8% retracement

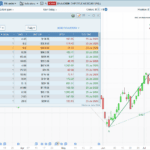
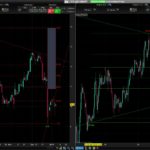
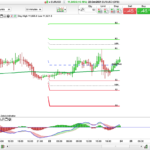
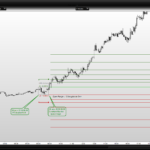
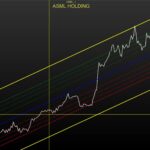
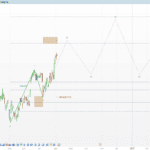
This is a stock screener that catch candlestick close which are within 1% of the last 65 days 61.8% retracement (38.2% for a up trend) of Fibonacci levels.
While price usually bounce on Fibonacci levels, this one can reveal good entry point for trend continuation.
hh = highest[65](high)
ll = lowest[65](low)

fib618 = (hh-ll)*0.618

level618 = ll+fib618

nearpercent =  ABS(1-(close/level618))*100

SCREENER[nearpercent<1]
Comments
You must be logged in to post a comment.

Bonjour Nicolas, Merci pour ce screener. Si je visualise bien son fonctionnement pour une tendance à la hausse, j'ai plus de mal à la baisse. Saurais-tu comment coder l'équivalent dans une tendance baissière ?


Hola, Nicolas
Sigo intentando emplear este indicador para hacer un screener, y su ayuda me puede venir muy bien.
¿Se podría programar el indicador para que únicamente obtenga resultados cuando el máximo se produce después del mínimo? (para así detectar correcciones en tendencias alcistas; o todo lo contrario para las tendencias bajistas...).


Ahh yes of course, 61.8 one way, 38.2 the other. Any ideas on how to display graphically which candles were used for the retracement or plot the fib?

Hello Nicolas, I want t use this screener, but only results for uptrend. Is there a possibillity to ad a condition like “the ll has to be older than the hh? I tried something with barindex but I couldn´t code it. Thank you for help.
Hi Nicolas this seems to return in both directions, uptrend and downtrend.
would it still be accurate as 618 is being added to the low, shouldn't it be subtracted from the high for uptrend retracement ect?
what if we wanted to confirm the resumption of the trend? would it be as simple as checking that the current high > low and vice versa?
Hello, I want t use this screener, but only results for uptrend. Is there a possibillity to ad a condition like "the ll has to be older than the hh? I tried something with barindex but I couldn´t code it. Thank you for helb.