

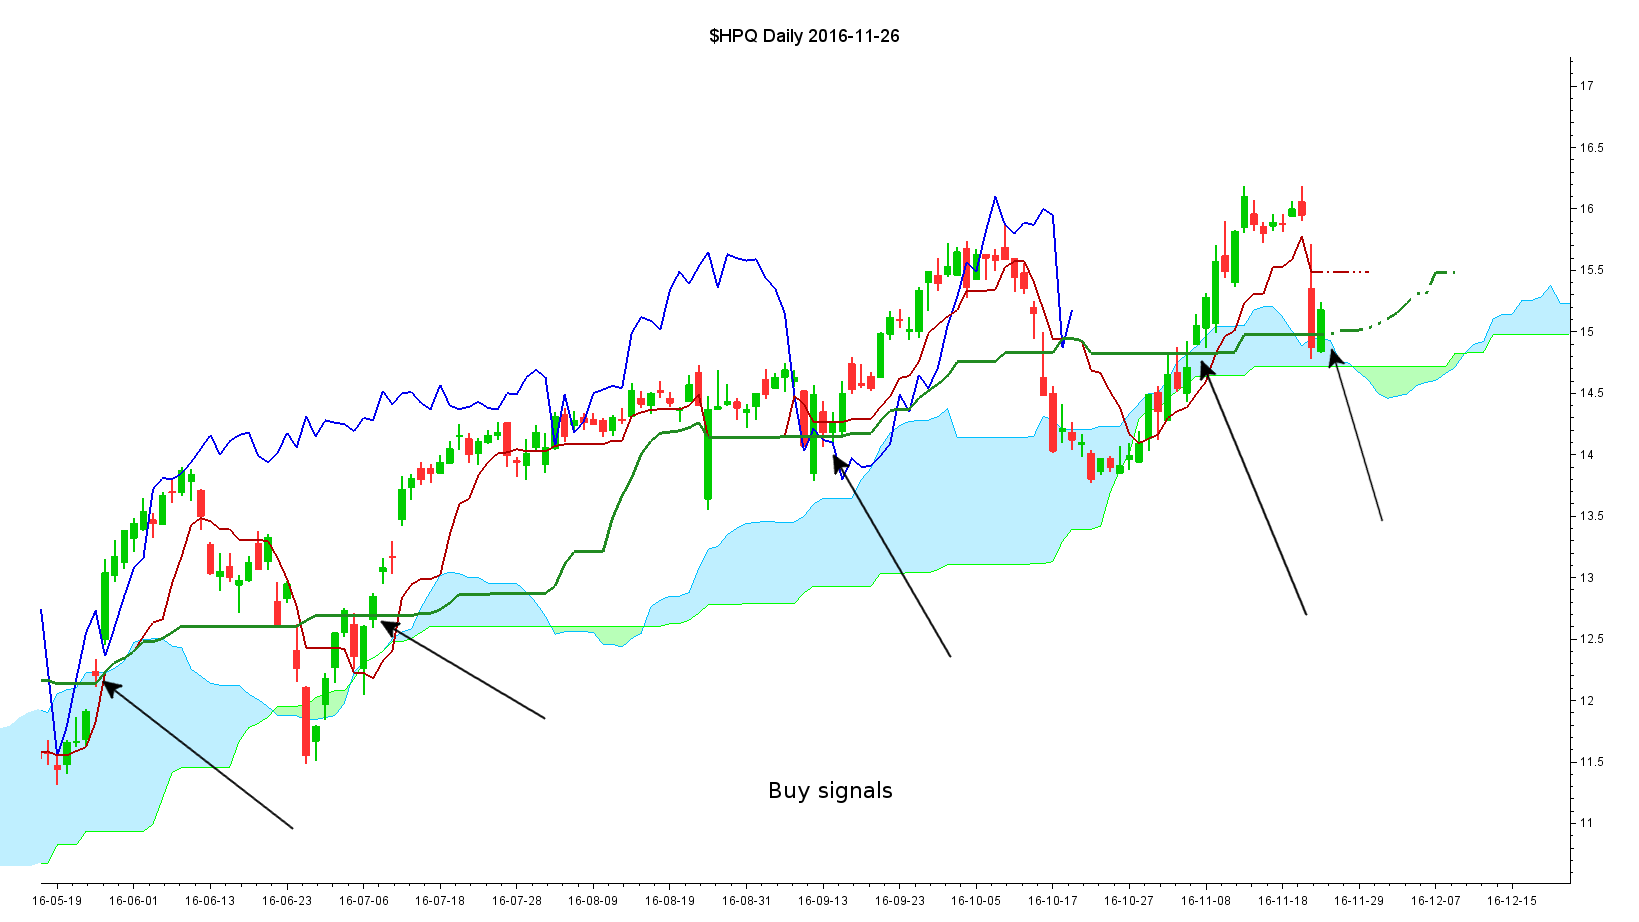
Daily throwback on Kijun in weekly uptrend using Ichimoku Kinko Hyo
November 28, 2016, 4:07 PM
Screeners
3 Comments
The simple strategy used in this screener is to find buying opportunity by locating daily throwback on Kijun Sen in a weekly uptrend using the Ichimoku Kinko Hyo system.
Use money management to limit the risk by trade.
//  Copyright (C) 2016 tasciccac.
//
//  This is free software: you can redistribute it and/or modify
//  it under the terms of the GNU General Public License as published by
//  the Free Software Foundation, either version 3 of the License, or
//  (at your option) any later version.
//
//  This is distributed in the hope that it will be useful,
//  but WITHOUT ANY WARRANTY; without even the implied warranty of
//  MERCHANTABILITY or FITNESS FOR A PARTICULAR PURPOSE.  See the
//  GNU General Public License for more details.
//
//  You should have received a copy of the GNU General Public License
//  along with this.  If not, see <http://www.gnu.org/licenses/>.

//  The simple strategy used in this screener is to find buying opportunity
//  Locate daily throwback on Kijun Sen in a weekly uptrend using Ichimoku Kinko Hyo system
//  Use money management to limit the risk by trade

// Tenkan Sen Period
TenkanSenPeriod = 9
// Kijun Sen Period
KijunSenPeriod = 26
// Senkou Span Period
SenkouSpanPeriod = 52

// Select the weekly time frame
// To ensure a normal bullish trend
TIMEFRAME(weekly)

// Weekly Tenkan Sen
TenkanSenW = (Highest[TenkanSenPeriod](High) + Lowest[TenkanSenPeriod](Low)) / 2
// Weekly Kijun Sen
KijunSenW = (Highest[KijunSenPeriod](High) + Lowest[KijunSenPeriod](Low)) / 2
// Weekly SSA Senkou Sen A
SenkouSpanAFutureW = (TenkanSenW + KijunSenW)/2
// Weekly SSB Senkou Sen B
SenkouSpanBFutureW = (Highest[SenkouSpanPeriod](High) + Lowest[SenkouSpanPeriod](Low))/2

// Compute Trend Normality
// Normality Of Trend is a Tasciccac indicator used to grade the quality of a trend
// Normality Of Trend > 100 => Trend overheating (ie Overbuy)
// 0 < Normality Of Trend < 100 => Trend normal => This is the configuration we look for a swing in this strategy
// Normality Of Trend < 0 => Attempt a trend reversal
// To find the trend direction I compare SenkouSenAFutureW & SenkouSenBFutureW
// if (SenkouSenAFutureW > SenkouSenBFutureW) => BULLISH
// if (SenkouSenAFutureW < SenkouSenBFutureW) => BEARISH
NormalityOfTrendNormalityW = (TenkanSenW - KijunSenW) / (SenkouSpanAFutureW - SenkouSpanBFutureW)

// With this condition we ensure the trend is clearly bullish in weekly
TheWeeklyTrendIsBullishNormal=((SenkouSpanAFutureW > SenkouSpanBFutureW) AND (NormalityOfTrendNormalityW > 0) AND (NormalityOfTrendNormalityW < 100))

// Chikou is above its candle in weekly
ChikouIsAbovePricesW = (Close > High[KijunSenPeriod])

// In daily time frame we look for a throwback below Kijun, while Tenkan stays above Kijun
TIMEFRAME(daily)

// Daily Tenkan Sen
TenkanSenD = (Highest[TenkanSenPeriod](High) + Lowest[TenkanSenPeriod](Low)) / 2
// Daily Kijun Sen
KijunSenD = (Highest[KijunSenPeriod](High) + Lowest[KijunSenPeriod](Low)) / 2
// Daily SSA Senkou Span A
//SenkouSpanAFutureD = (TenkanSenD + KijunSenD)/2
// Daily SSB Senkou Span B
//SenkouSpanBFutureD = (Highest[SenkouSpanPeriod](High) + Lowest[SenkouSpanPeriod](Low))/2

// Condition Tenkan is above Kijun
TenkanSenIsAboveKijunSenDaily = (TenkanSenD > KijunSenD)

// We look for a crosses over Kijun
PriceCrossesOverKijunDaily = ((Close[1] < KijunSenD) AND (Close > KijunSenD))

// Mean volume on Kijun Sen period
VolumeMeanKijunSenPeriod = Average[KijunSenPeriod](Volume)
ROCVolume = 100*(Volume / VolumeMeanKijunSenPeriod)

SCREENER[TheWeeklyTrendIsBullishNormal AND ChikouIsAbovePricesW AND TenkanSenIsAboveKijunSenDaily AND PriceCrossesOverKijunDaily] SORT BY ROCVolume AS "Rate of Change Volume"
Download
Filename:
Throwback-Kijun.itf
Downloads:
822
New
As an architect of digital worlds, my own description remains a mystery. Think of me as an undeclared variable, existing somewhere in the code.
Author’s Profile
Loading...