

Cumulated Volume Velocity screener
June 3, 2019, 8:11 AM
Screeners
0 Comments
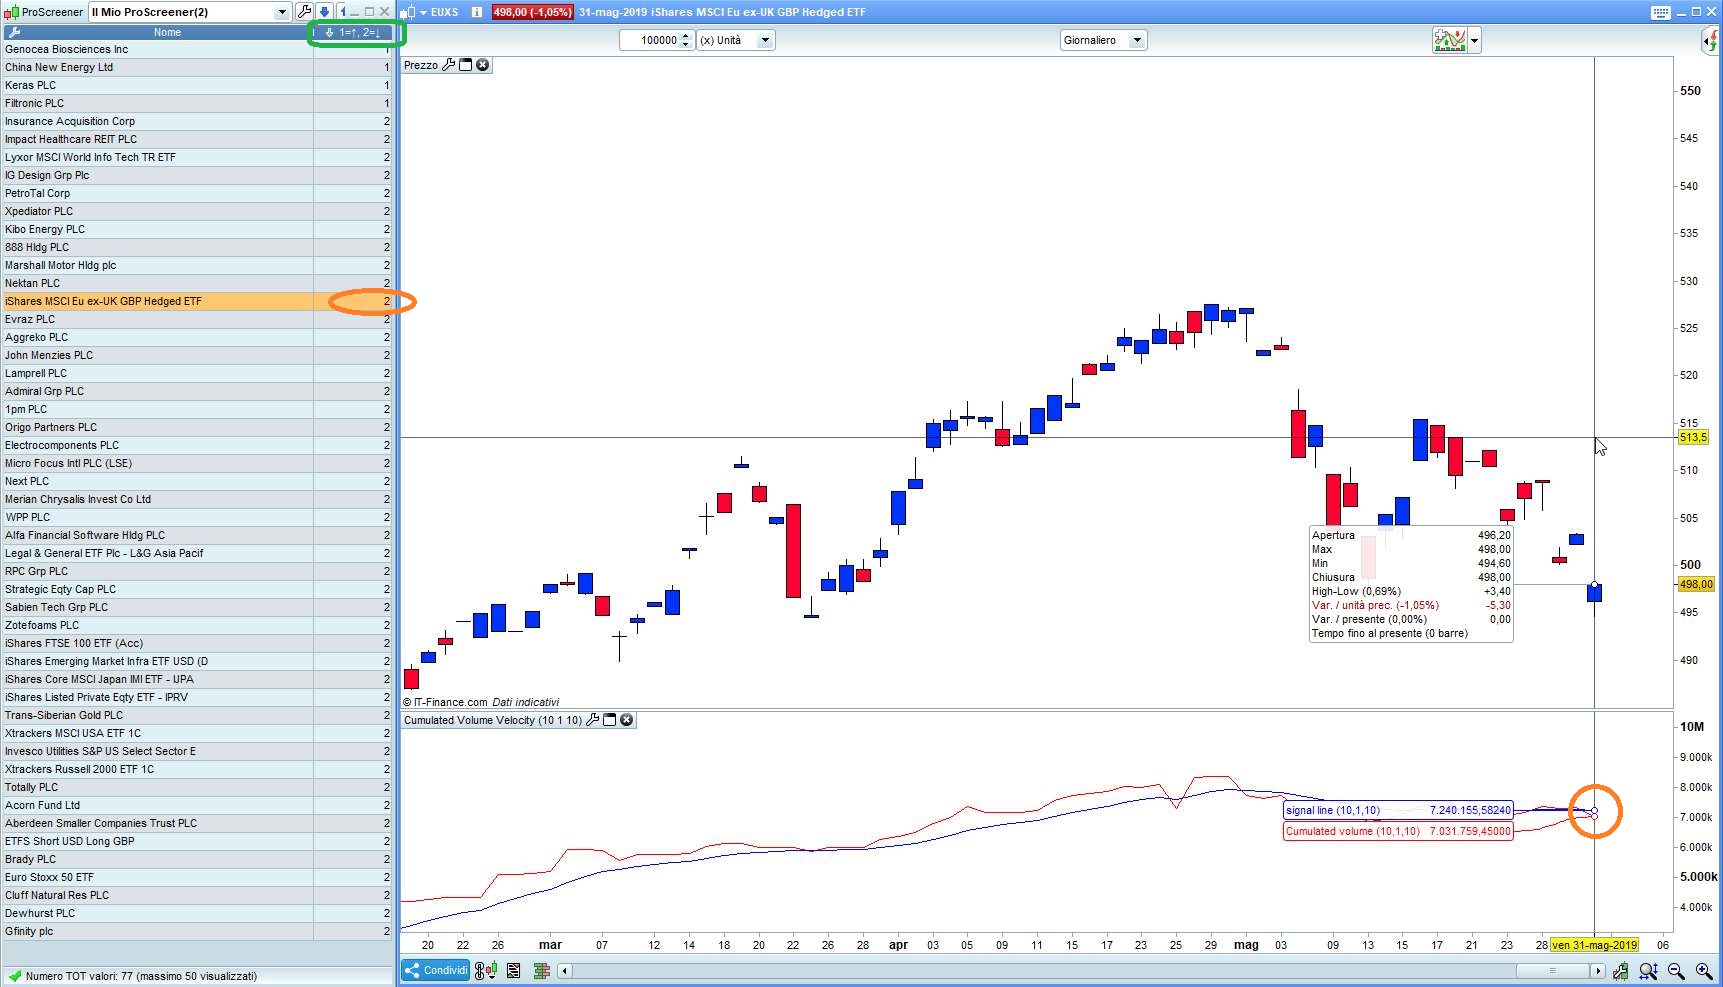
After studying and using Nicolas’Cumulated Volume Velocity indicator (https://www.prorealcode.com/prorealtime-indicators/cumulated-volume-velocity/), I wrote this simple screener to detect bullish and bearish crossings:
p    = 10     //10 periods
t    = 1      //1 = ema
Bars = 10     //10 bars
if barindex > Bars then
   if (high<high[1] AND low<low[1]) then
      CumVolVel = CumVolVel[1]-Range*Volume
   elsif (high>high[1] AND low>low[1]) then
      CumVolVel = CumVolVel[1]+Range*Volume
   else
      CumVolVel = CumVolVel[1]
   endif
endif
avg = average[p,t](CumVolVel)
//RETURN CumVolVel coloured(255,0,0) as "Cumulated volume", avg coloured(0,0,255) as "signal line"
x = 0
IF CumVolVel CROSSES OVER avg THEN
   x = 1
ELSIF CumVolVel CROSSES UNDER avg THEN
   x = 2
ENDIF
SCREENER[x](x AS "1=↑, 2=↓")
Download
Filename:
Cumulated-Volume-Velocity.itf
Downloads:
237
Download
Filename:
picA.jpg
Downloads:
74

Master
Roberto
https://www.ots-onlinetradingsoftware.com
Author’s Profile
Loading...