





Correlation Screener: Which Stocks Move with NVDA (or Any Other Stock)
Introduction
“Which stocks move together with NVDA?” is a question that comes up again and again: to find the names that follow a leader, to avoid holding three positions that are really the same bet, or to know where to look when the leader gaps in the pre-market.
There is no built-in correlation function to call, but ProScreener can read a second instrument with EQUITYFRAME. Put the two together and you get a scan that measures, for every stock of a market or a list, how closely it follows one reference stock, and lists the ones above the threshold you choose.
What It Screens
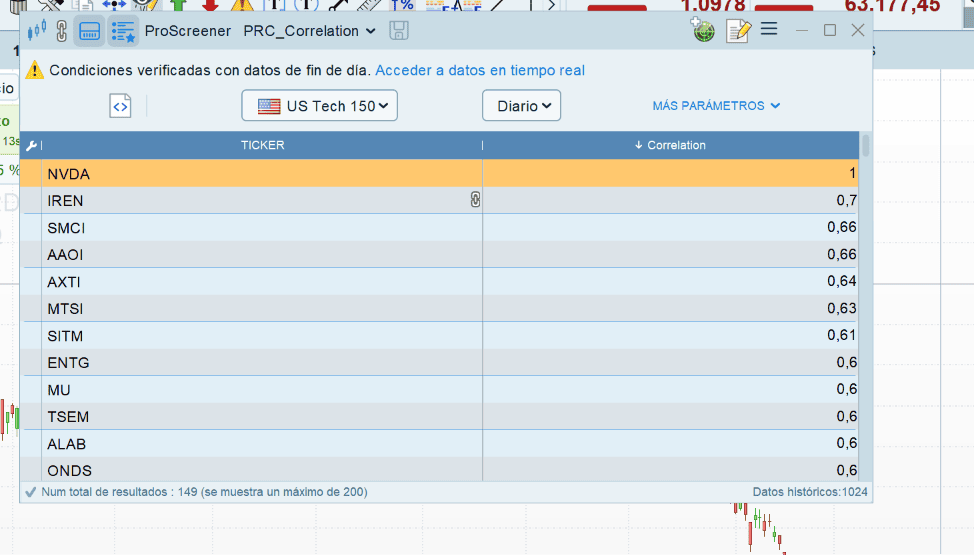
For each stock scanned, the screener computes the Pearson correlation between its daily returns and the daily returns of the reference stock over the last corrLen daily bars. Stocks whose correlation is at least minCorr are listed, with the correlation as the result column, so you can sort the list from the closest follower down.
The reference is set on the EQUITYFRAME line. In the code it is NVDA, but it can be any instrument you can open in the platform: an index, an ETF, another stock.
Why Returns and Not Prices
This is the part that decides whether the list means anything. Correlating prices rewards any two instruments that trended in the same direction over the window, even if they never moved on the same days. Correlating daily percentage changes asks a different question: when one rises or falls, does the other do the same on the same day?
An example with real data, over the same 63 sessions: Coca-Cola against NVDA gives a correlation of -0.88 on prices and -0.40 on daily returns. The price figure is close to a perfect inverse relationship, but only because one drifted down while the other drifted up over those three months. The return figure says there is a mild tendency to move in opposite directions, and nothing more.
Reading the Result
- 1.00: the stock moves exactly with the reference. The reference itself, if it is in the scanned list, always shows 1.00.
- 0.7 and above: a strong link. On daily returns of individual stocks this is a high bar: it is usually reached by stocks of the same industry or by ETFs that hold the reference.
- Around 0.5: a clear but loose link.
- Around 0: no relationship.
- Negative values: the stock tends to move against the reference.
As a reference point, a scan of the 149 stocks of US Tech 150 against SPY over 63 sessions put the closest followers at 0.74 to 0.77 (AMD, ADI, Interactive Brokers, Navitas), most large technology stocks between 0.5 and 0.7, and consumer staples such as PepsiCo or Mondelez slightly negative.
How to Use It
- Pick the reference. Change the
EQUITYFRAMEline to the stock, ETF or index you want to follow. The easiest way is to select it with the instrument search of the ProScreener editor, which fills in the market for you. - Pick the window.
corrLen = 63is about three months of daily bars, 126 about six. Shorter windows react faster to a change of regime; longer ones are more stable. - Start with a lower threshold. With
minCorr = 0.7few stocks will pass. Start at 0.5, look at the list, and raise it. - Save the result as a list. Correlation over months changes slowly, so there is no need to run this every day. Run it now and then, keep the followers in a list, and use that list with your other screeners and charts.
- Check it once. Include the reference stock in the scan: if it does not show 1.00, the reference line is not pointing where you think.
Configuration
corrLen= 63: number of daily bars in the correlation window. It fits in the bars a screener receives on both Complete (255) and Premium (1024).minCorr= 0.7: minimum correlation to be listed.EQUITYFRAME("NASDAQ","NVDA"): the reference instrument.
How It Is Calculated
The correlation is the covariance of the two return series divided by the product of their standard deviations. Each piece is built from moving averages over the same corrLen bars:
- covariance = average of (x times y) minus (average of x) times (average of y)
- variance = average of x squared minus (average of x) squared
Building the variances from the same averages, instead of mixing in a standard deviation function with its own convention, keeps the three terms consistent, and the correlation of a series with itself comes out at exactly 1. No loop is needed, so the scan stays fast across a whole market.
Code
//-------------------------------------------------------------------------
//PRC_Correlation with a Reference Stock - SCREENER
//version = 0
//18.11.2026
//Ivan Gonzalez @ www.prorealcode.com
//Sharing ProRealTime knowledge
//-------------------------------------------------------------------------
// For every stock of the market or list you scan, the correlation of its
// daily returns with the daily returns of one reference stock (NVDA here)
// over the last corrLen daily bars. Only stocks with a correlation of at
// least minCorr are listed, sorted by correlation.
//
// Why returns and not prices: two stocks that both trend up for months
// show a price correlation close to 1 even if they never move together
// day by day. The correlation of daily % changes measures whether they
// rise and fall on the same days.
//
// How to run it:
// - Timeframe: daily.
// - Selection: a market (e.g. NASDAQ) or one of your lists.
// - Check: if the reference stock itself is in the scanned list, it must
//   show a correlation of 1.00.
//
// To use another reference stock, change the EQUITYFRAME line. If the
// screener does not run or returns nothing, select the reference again
// with the instrument search of the ProScreener editor: the editor then
// completes the line with the market it needs.
//-------------------------------------------------------------------------

//--- Settings ------------------------------------------------------------
corrLen = 63        // daily bars: 63 is about 3 months, 126 about 6 months
minCorr = 0.7       // minimum correlation to be listed

//--- Reference stock ------------------------------------------------------
EQUITYFRAME("NASDAQ","NVDA")
refRet = close / close[1] - 1
EQUITYFRAME(default)

//--- Scanned stock ---------------------------------------------------------
stkRet = close / close[1] - 1

//--- Pearson correlation of the two return series -------------------------
// corr = cov(x,y) / (sd(x) * sd(y)), with every term built from moving
// averages over the same corrLen bars.
retProd = stkRet * refRet
meanX = average[corrLen](stkRet)
meanY = average[corrLen](refRet)
covXY = average[corrLen](retProd) - meanX * meanY
varX = average[corrLen](stkRet * stkRet) - meanX * meanX
varY = average[corrLen](refRet * refRet) - meanY * meanY

IF barindex > corrLen AND varX > 0 AND varY > 0 THEN
   corrRef = covXY / SQRT(varX * varY)
ELSE
   corrRef = 0
ENDIF

SCREENER[corrRef >= minCorr](corrRef AS "Correlation")
Conclusion
Correlation is one of those numbers everybody talks about and few platforms let you scan for. With EQUITYFRAME and four moving averages, ProScreener turns it into a sortable list: pick a leader, pick a window, and see which stocks really move with it day by day, rather than which ones simply drifted the same way.