The “BUY Stock” screener

The “BUY Stock” screener

Hello fellow traders,

Here is a simple but very effective screener code of my own.
It detects the stocks that can be purchased.
These stocks must show some conditions, of course.
But it is not sufficient.
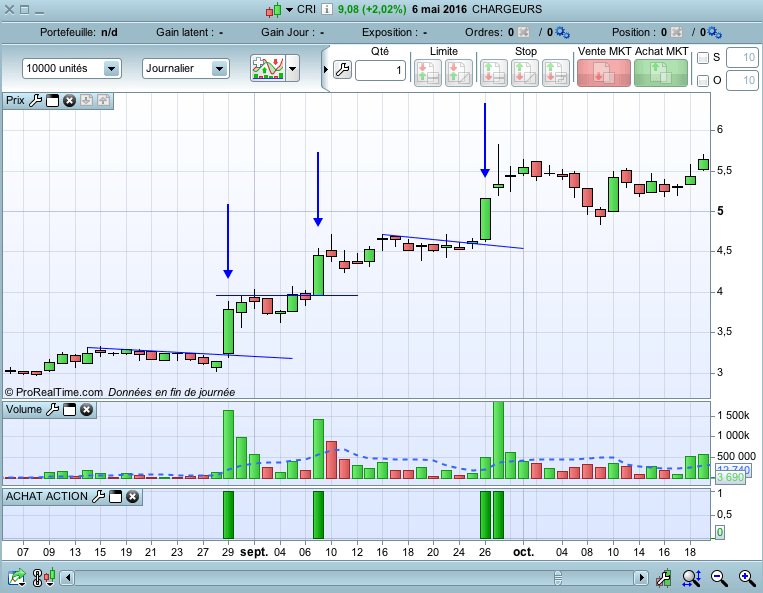
They must BREAK a TRENDLINE (a resistance).

And no code will detect this for you. That’s why we can’t backtest this kind of strategy. But it easy to make a screener, and an indicator.

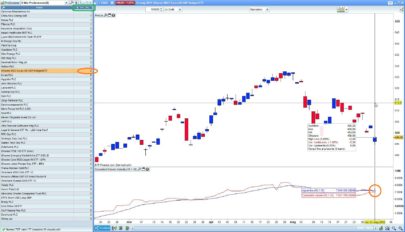
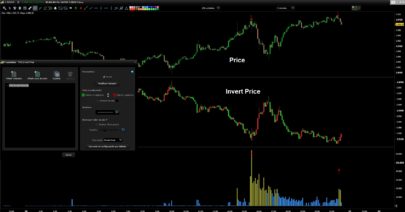
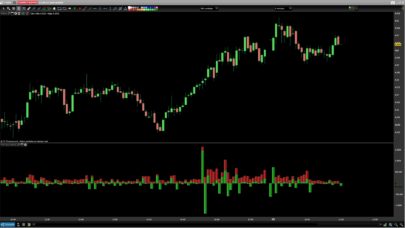
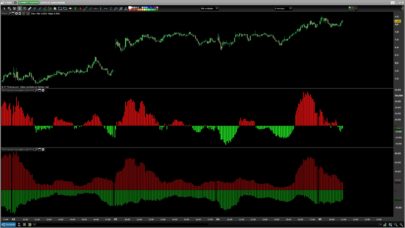
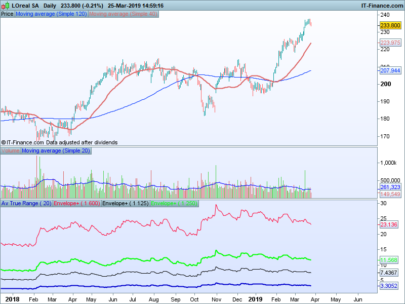
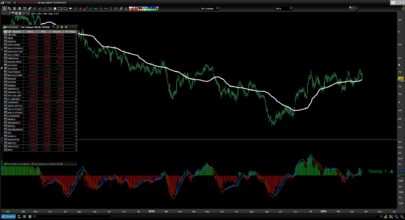
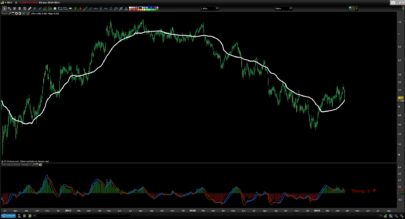
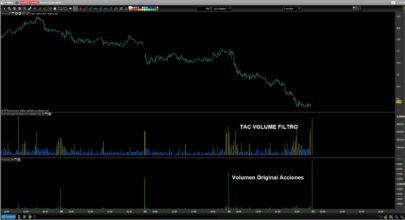
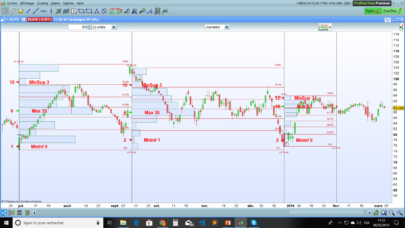
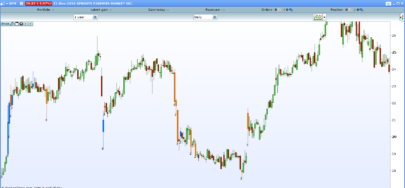
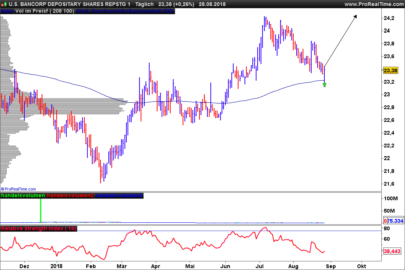
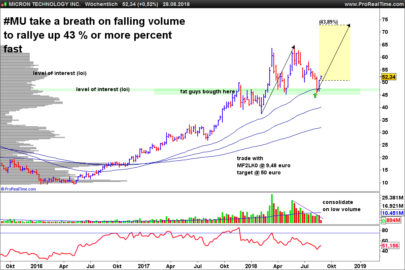
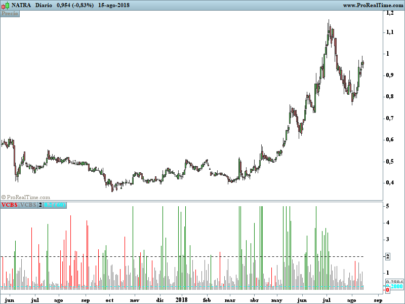
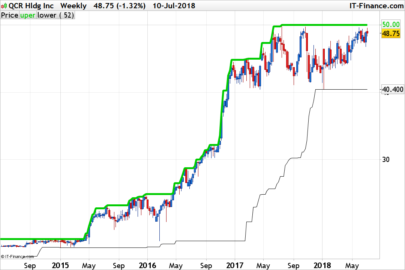
On the graphic, I did set the volumes, and the 10 average volumes.

I also show you some trendlines breaks on the same stock.

Share this

Risk disclosure:

No information on this site is investment advice or a solicitation to buy or sell any financial instrument. Past performance is not indicative of future results. Trading may expose you to risk of loss greater than your deposits and is only suitable for experienced investors who have sufficient financial means to bear such risk.

ProRealTime ITF files and other attachments : How to import ITF files into ProRealTime platform?

PRC is also on YouTube, subscribe to our channel for exclusive content and tutorials
  1. Nicolas • 05/08/2016 #

    Thanks Doc. If you want to test if your big candle have made a good move and have pierced a trendline, maybe you could just make a lookback with a simple loop in the previous candles and test if these ones were in a narrow range? Look for their highest and lowest values or average their prices to find the distance within the close of your big candle.

  2. Doctrading • 05/08/2016 #

    Hello, Nicolas.
    Yes, I did also think that it is possible : 

    add a criteria of candle size (with ADX, etc.)
    add a breakout of the 10 last high
    etc.

    But I think the best indicator is how do you see the candle. 
    If someone wants some more criteria, it is always possible.
    Best Regards, 

  3. Julien Krs • 05/08/2016 #

    Salut doc, pas moyen d’avoir un signal, j’ai beau screener tout le marché en Daily et Hebdo, je n’ai jamais le critère “1”

  4. Al Wikah • 05/08/2016 #

    Bonjour,
    Aucun retour de résultats
    Pour avoir des résultats j’ai commenté cette ligne :
    // c4 = Volume > 2*(Average[10](Volume))

  5. Al Wikah • 05/08/2016 #

    Sorry,
    l’indicateur fonctionne.
    Je n’avais pas vu les dernières lignes de commentaires
    Merci

  6. pata_tony • 05/08/2016 #

    Hi, i’m not able to see the indicator. Could you please help me? Thanks

    • Nicolas • 05/08/2016 #

      This is not an indicator but a screener, to be used with the ProScreener module.

  7. JOKAMAURICE • 05/08/2016 #

    Le programme ne se charge pas dans PRT

avatar
Register or

Likes

avatar avatar avatar avatar avatar avatar avatar avatar avatar avatar avatar avatar avatar avatar avatar avatar
Related users ' posts
TACBOLSA
5 years ago
dario ti please can you help me to understand? i know i am wrong: Long Histogram = High Volume S...
TAC Bolsa hi, I have already seen the problem and requested that it be removed until an adequate so...
sixeight Hey TAC, Did you ever find a solution to this?
Vinks_o_7 b=close > low and volume > high How can we compare volume and high of the day? (orang...
TAC Bolsa If to understand something you resort to compare Oranges and bananas. You go bad, Without e...
giumagi good morning Sir, great job your indicators! How can I reach your website or blog? please..t...
RobertFX Works fine
Kees Pols great tool! Thank you
tush1822 appreciate your post mate!! it helped me.
Gianluca THANK YOU!!!!!
JOSEBA que relaccion tiene la numeración de las barras del 1 al 10 que tiene cada número Tengo dos...
marcov66 Hi, it seems a very useful indicator. Unfortunately the link here for the full explanation d...
TACBOLSA Discontinued indicator. we are sorry.
Azzuerus Bonjour, je teste et j'utilise vos indicateurs depuis plusieurs années, et ils me sont dev...
bremze33 Another thing. Is it possible to make the graph lines a little thicker and not so long? Be...
giumagi Hi Sir, very good job done with this indicator, May I ask you to explain what is the line VW...
pmdr1969 Hola soy nuevo en en esto. ¿Hay algo parecido pero pudiendo tu elegir las velas a a analizar...
Nicolas Add indicator on price doesnt require any specific type of subcription. Click on the wrench ...
tahiti bonjour j'ai une petite question comment peux on enlevé la bar blanche sur la bougie en cour...
sixeight Hi Kris, is there a way to increase the number of rows? I get a loop error
Real Pro Great work gabri. I have this coded on Amibroker and I have done lots of backtesting but ne...
gabri Hi Real Pro, this indicator assists novices of the Wyckoff system. Wyckoff himself thought t...
tatie hi Gabri, I just came across the wyckoff method and was looking for the weiss wave indica...
Jesper Great share!
eckaw Hi Nicolas, I'm using this indicator when there is confluence over 3 different timeframes (5...
Nicolas Yes it is indeed possible. Create a topic in the screener forum and explain what you need an...
KyleReed i've been using this for a few days now and it's really helped me a lot in timing the execut...
Ben Ji Bonjour Nicolas, je souhaiterais exploiter votre screener sur la plateforme TradingView. Pou...
Nicolas Non désolé, je ne fournis pas de support pour cette plateforme.
luxrun Thanks, bolsatrilera, for a very good and solid screener!
luxrun sorry... indicator!
Lily Rios Gracias por el indicador, tengo una pregunta necesito programar un screener de valores que e...
fredfilm Hi Nicolas, how could we add a price screen to this? eg stock prices between $1 to $3 etc

Top