

The "BUY Stock" screener
May 8, 2016, 12:53 PM
Screeners
8 Comments
Hello fellow traders,
Here is a simple but very effective screener code of my own.
It detects the stocks that can be purchased.
These stocks must show some conditions, of course.
But it is not sufficient.
They must BREAK a TRENDLINE (a resistance).
And no code will detect this for you. That’s why we can’t backtest this kind of strategy. But it easy to make a screener, and an indicator.
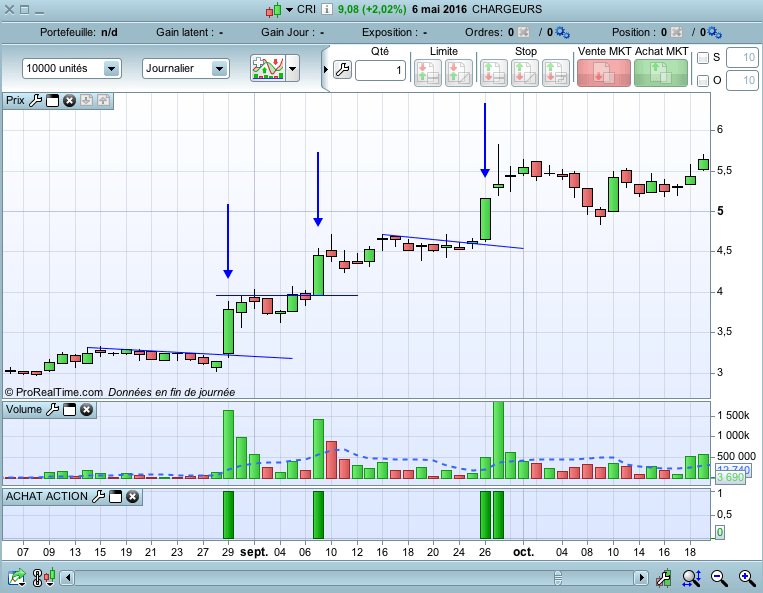
On the graphic, I did set the volumes, and the 10 average volumes.
I also show you some trendlines breaks on the same stock.
c1 = average[50] > average[200]

c2 = close > average[50]

c3 = close > open

c4 = Volume > 2*(Average[10](Volume))

c5 = Volume > Volume[1] and Volume > Volume[2] and Volume > Volume[3]

c6 = Volume > 20000

c7 = ForceIndex > 10000

c8 = RSI[70] > 51  // it means RSI[14] on weekly timeframe, because 1 week = 5 days

IF c1 and c2 and c3 and c4 and c5 and c6 and c7 and c8 THEN

ACHAT = 1

ELSE

ACHAT = 0

ENDIF

screener[ACHAT]
// To get the indicator, replace this last line by :
//return ACHAT
Download
Filename:
ACHAT-ACTIONS.itf
Downloads:
987
Master
Hello, I'm Marc.
Nice to meet you.
Author’s Profile
Loading...