

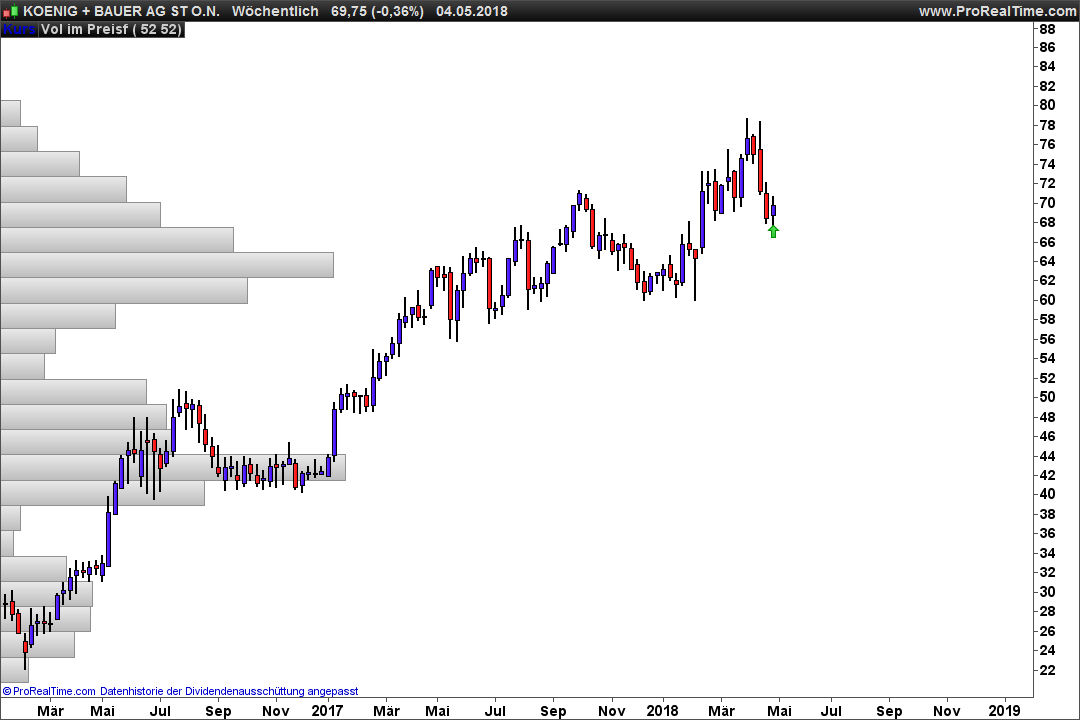
Buy Long Stocks in an consolidation with a solid uptrend (weekly)
May 7, 2018, 11:26 AM
Screeners
2 Comments
- i use it on weekly chart for lower noise
- the valid trend is measured with the system quality number von van tharp
- i used it to trade german extra stocks
- i only wanna stocks with a total tradet volume (close * volume) of 3 mio euro (you can change this value)
- no optimization needed
- give every week just a few candidates but often that rocks
// Beispielcode Screener////////////////////////////////////////////////////////////////// Suche einen stabilen Trend von 100 Wochen bis 200 Wochen
ProfitSer = ROC[1](Close)
//Bar = Barindex - 1
ProfitSMA = Average[100](ProfitSer)
sqn = sqrt(100) * ProfitSMA / STD[100](ProfitSer)

ProfitSer1 = ROC[1](Close)
//Bar = Barindex - 1
ProfitSMA1 = Average[104](ProfitSer1)
sqn1 = sqrt(104) * ProfitSMA1 / STD[104](ProfitSer1)

ProfitSer2 = ROC[1](Close)
//Bar = Barindex - 1
ProfitSMA2 = Average[108](ProfitSer2)
sqn2 = sqrt(108) * ProfitSMA2 / STD[108](ProfitSer2)

ProfitSer3 = ROC[1](Close)
//Bar = Barindex - 1
ProfitSMA3 = Average[112](ProfitSer3)
sqn3 = sqrt(112) * ProfitSMA3 / STD[112](ProfitSer3)

ProfitSer4 = ROC[1](Close)
//Bar = Barindex - 1
ProfitSMA4 = Average[116](ProfitSer4)
sqn4 = sqrt(116) * ProfitSMA4 / STD[116](ProfitSer4)

ProfitSer5 = ROC[1](Close)
//Bar = Barindex - 1
ProfitSMA5 = Average[120](ProfitSer5)
sqn5 = sqrt(120) * ProfitSMA5 / STD[120](ProfitSer5)

ProfitSer6 = ROC[1](Close)
//Bar = Barindex - 1
ProfitSMA6 = Average[124](ProfitSer6)
sqn6 = sqrt(124) * ProfitSMA6 / STD[124](ProfitSer6)

ProfitSer7 = ROC[1](Close)
//Bar = Barindex - 1
ProfitSMA7 = Average[128](ProfitSer7)
sqn7 = sqrt(100) * ProfitSMA7 / STD[128](ProfitSer7)

ProfitSer8 = ROC[1](Close)
//Bar = Barindex - 1
ProfitSMA8 = Average[132](ProfitSer8)
sqn8 = sqrt(100) * ProfitSMA8 / STD[132](ProfitSer8)

ProfitSer9 = ROC[1](Close)
//Bar = Barindex - 1
ProfitSMA9 = Average[136](ProfitSer9)
sqn9 = sqrt(136) * ProfitSMA9 / STD[136](ProfitSer9)

ProfitSer10 = ROC[1](Close)
//Bar = Barindex - 1
ProfitSMA10 = Average[140](ProfitSer10)
sqn10 = sqrt(140) * ProfitSMA10 / STD[140](ProfitSer10)

ProfitSer11 = ROC[1](Close)
//Bar = Barindex - 1
ProfitSMA11 = Average[144](ProfitSer11)
sqn11 = sqrt(144) * ProfitSMA11 / STD[144](ProfitSer11)

ProfitSer12 = ROC[1](Close)
//Bar = Barindex - 1
ProfitSMA12 = Average[148](ProfitSer12)
sqn12 = sqrt(148) * ProfitSMA12 / STD[148](ProfitSer12)

ProfitSer13 = ROC[1](Close)
//Bar = Barindex - 1
ProfitSMA13 = Average[152](ProfitSer13)
sqn13 = sqrt(152) * ProfitSMA13 / STD[152](ProfitSer13)

ProfitSer14 = ROC[1](Close)
//Bar = Barindex - 1
ProfitSMA14 = Average[156](ProfitSer14)
sqn14 = sqrt(156) * ProfitSMA14 / STD[156](ProfitSer14)

ProfitSer15 = ROC[1](Close)
//Bar = Barindex - 1
ProfitSMA15 = Average[160](ProfitSer15)
sqn15 = sqrt(160) * ProfitSMA15 / STD[160](ProfitSer15)

ProfitSer16 = ROC[1](Close)
//Bar = Barindex - 1
ProfitSMA16 = Average[164](ProfitSer16)
sqn16 = sqrt(164) * ProfitSMA16 / STD[164](ProfitSer16)

ProfitSer17 = ROC[1](Close)
//Bar = Barindex - 1
ProfitSMA17 = Average[168](ProfitSer17)
sqn17 = sqrt(168) * ProfitSMA17 / STD[168](ProfitSer17)

ProfitSer18 = ROC[1](Close)
//Bar = Barindex - 1
ProfitSMA18 = Average[172](ProfitSer18)
sqn18 = sqrt(172) * ProfitSMA18 / STD[172](ProfitSer18)

ProfitSer19 = ROC[1](Close)
//Bar = Barindex - 1
ProfitSMA19 = Average[176](ProfitSer19)
sqn19 = sqrt(176) * ProfitSMA19 / STD[176](ProfitSer19)

ProfitSer20 = ROC[1](Close)
//Bar = Barindex - 1
ProfitSMA20 = Average[180](ProfitSer20)
sqn20 = sqrt(180) * ProfitSMA20 / STD[1180](ProfitSer20)

ProfitSer21 = ROC[1](Close)
//Bar = Barindex - 1
ProfitSMA21 = Average[184](ProfitSer21)
sqn21 = sqrt(184) * ProfitSMA21 / STD[184](ProfitSer21)

ProfitSer22 = ROC[1](Close)
//Bar = Barindex - 1
ProfitSMA22 = Average[188](ProfitSer22)
sqn22 = sqrt(188) * ProfitSMA22 / STD[188](ProfitSer22)

ProfitSer23 = ROC[1](Close)
//Bar = Barindex - 1
ProfitSMA23 = Average[192](ProfitSer23)
sqn23 = sqrt(192) * ProfitSMA23 / STD[192](ProfitSer23)

ProfitSer24 = ROC[1](Close)
//Bar = Barindex - 1
ProfitSMA24 = Average[196](ProfitSer24)
sqn24 = sqrt(196) * ProfitSMA24 / STD[196](ProfitSer24)

ProfitSer25 = ROC[1](Close)
//Bar = Barindex - 1
ProfitSMA25 = Average[200](ProfitSer12)
sqn25 = sqrt(200) * ProfitSMA25 / STD[200](ProfitSer25)
// 25 Variablen werden nach einem SQN über 2.5 abgetastet
c0 = sqn > 2.0
c1 = sqn1 > 2.0
c2 = sqn2 > 2.0
c3 = sqn3 > 2.0
c4 = sqn4 > 2.0
c5 = sqn5 > 2.0
c6 = sqn6 > 2.0
c7 = sqn7 > 2.0
c8 = sqn8 > 2.0
c9 = sqn9 > 2.0
c10 = sqn10 > 2.0
c11 = sqn11 > 2.0
c12 = sqn12 > 2.0
c13 = sqn13 > 2.0
c14 = sqn14 > 2.0
c15 = sqn15 > 2.0
c16 = sqn16 > 2.0
c17 = sqn17 > 2.0
c18 = sqn18 > 2.0
c19 = sqn19 > 2.0
c20 = sqn20 > 2.0
c21 = sqn21 > 2.0
c22 = sqn22 > 2.0
c23 = sqn23 > 2.0
c24 = sqn24 > 2.0
c25 = sqn25 > 2.0
// Einer der 25 Variablen musst über 2.5 liegen
c25 = c0 or c1 or c2 or c3 or c4 or c5 or c6 or c7 or c8 or c9 or c10 or c11 or c12 or c13 or c14 or c15 or c16 or c17 or c18 or c19 or c20 or c21 or c22 or c23 or c24 or c25
// Penny Stock Filter
c26 = close > 1.0
// Ausverkauf
c27 = RSI[2](close) < 10
//Ausverkauf muss heute oder gestern stattgefunden haben
// Volumenfilter 3 Mio Handelsvolumen  eines S-Dax Wertes
c29 = Average[52](volume*close) > 3000000
c30 = close > Average[50](close)
c31 = Average[50](close) > Average[50](close)[1]
SCREENER[c25 and c26 and c27 and c29 and c30 and c31] sort by volume*close
Download
Filename:
LongStocks-in-uptrendweekly.itf
Downloads:
574
Veteran
secundary school-education to banker staff-multiple host part time - economist partime like: reading-thinking biases and chess.
Author’s Profile
Loading...