

Alligator Long Breakout (from Bill Williams)
May 9, 2018, 8:40 AM
Screeners
1 Comment
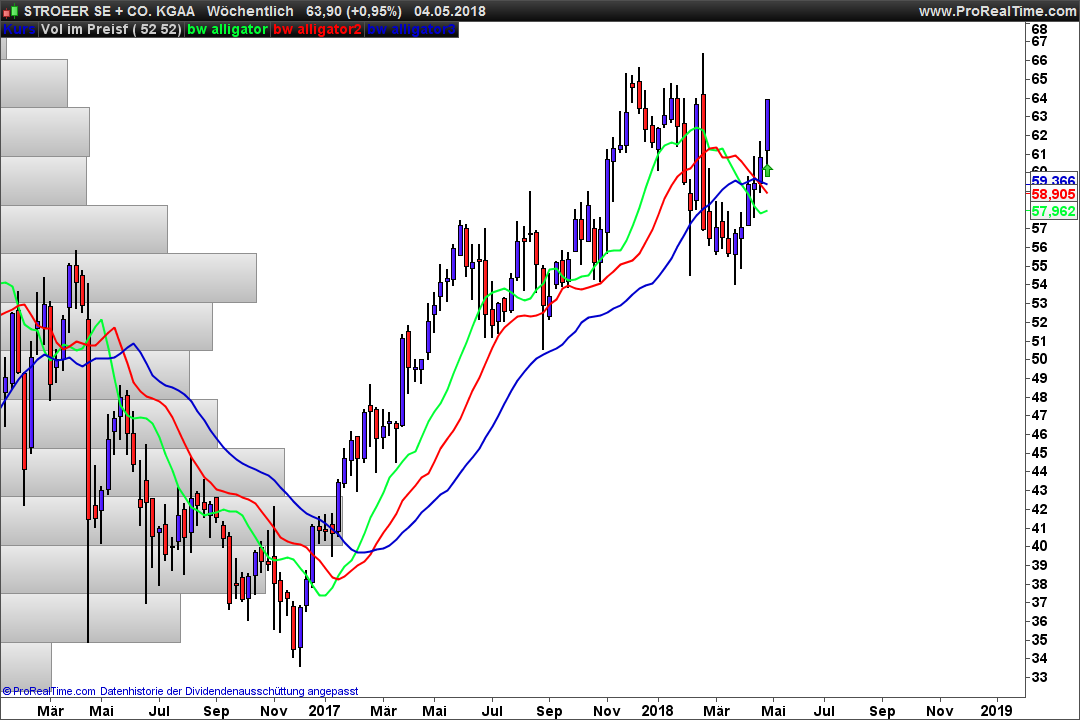
i use it on weekly chart for lower noise
the trend is measured with the bill williams alligator
i used it to trade german xetra stocks
i only wanna stocks with a total traded volume (close * volume) of 3 mio euro (you can change this value)
no optimization needed
give every week a lot of stocks – cherry pick the beauties with your eye
stop loss is the red alligator linie – often nice upswings are found
c2 = WilderAverage[8]((high+low)/2)[5]
c3 = WilderAverage[13]((high+low)/2)[8]
c4 = average[52](close*volume) > 3000000
c5 = average[52](close*volume)
c6 = c3 > c2
c7 =  close > c3 and close[1] < c3[1]
c8 = c7 or c7[1] or c7[2] or c7[3]
c9 = close > c2
SCREENER[c4 and c6 and c8 and c9](c5 as "traded volume")
Download
Filename:
Alligator-Long-Breakout.itf
Downloads:
307
Veteran
secundary school-education to banker staff-multiple host part time - economist partime like: reading-thinking biases and chess.
Author’s Profile
Loading...