

ZigZag SupDem (supply and demand zones)
March 13, 2019, 10:06 AM
Indicators
19 Comments
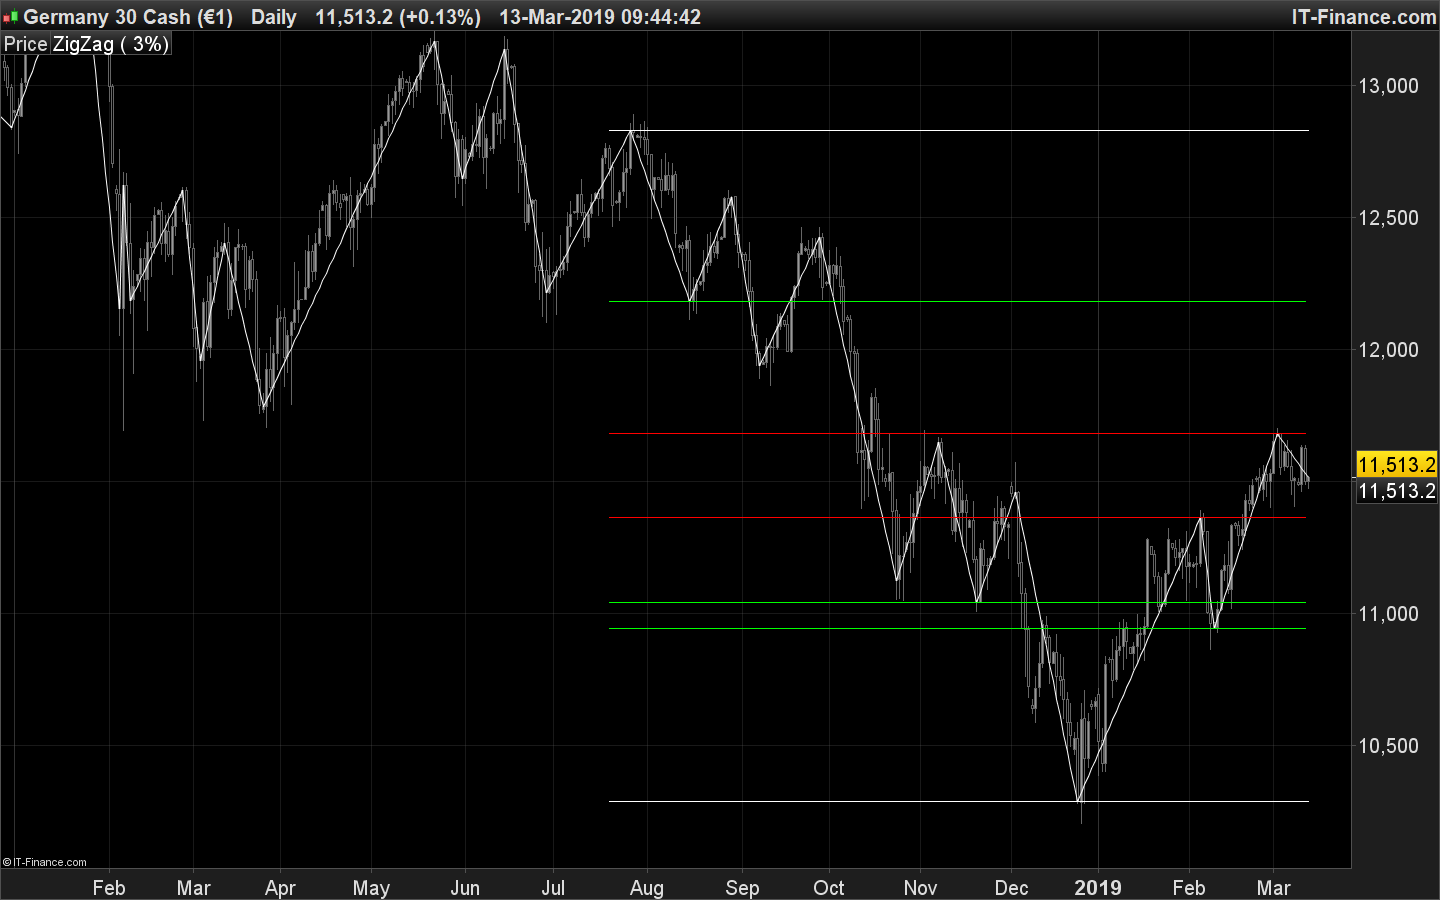
The ZigZag SupDem Zones Indicator detects support and resistance (supply and demand) zones using peaks and troughs formed by the ZigZag.
Depending on the timeframe used, it is necessary to set the necessary percentage to form a new peak or trough, by default that is set to 3%, ideal for most instruments on a unit of daily time.
The detection will be done only on the last periods set by the variable “lookback”.
The detection is validated if the indicator finds at least “minPoints” troughs or peaks not more distant than at most “threshold” in percentage.
- percent = 3 (percentage change of ZigZag to get new peaks and troughs, new swings)
- lookback = 200 (the period to search for supports and resistances)
- threshold = 1 (percentage to validate another zigzag from the one previously found to validate a support or a resistance)
- minPoint = 2 (at least it takes 2 swings of the same type, located one another less than “threshold” percent to validate a support or resistance)
//PRC_ZigZag SupDem | indicator
//13.03.2019
//Nicolas @ www.prorealcode.com
//Sharing ProRealTime knowledge

defparam drawonlastbaronly=true
defparam calculateonlastbars=1000

// --- settings
percent = 3 //zigzag percent
lookback = 100 //max history lookback
threshold = 1 //price percent between 2 ZZ points
minPoint = 2 //minimal points to confirm S/R
showSupport = 1 //plot support zones or not? (0=false;1=true)
showResistance = 1 //plot resistance zones or not? (0=false;1=true)
// --- end of settings

//zz s/r
zz = ZigZag[percent](customclose)
p = zz<zz[1] and zz[1]>zz[2]
t = zz>zz[1] and zz[1]<zz[2]
if p then
 top = zz[1]
endif
if t then
 bottom = zz[1]
endif

once minPoint = max(2,minPoint)

for i = 1 to lookback do
 if showResistance then
 //new peak
  if p[i] then
   topdata = top[i]
   hhtop = topdata+(customclose[i]*(threshold/100))
   lltop = topdata-(customclose[i]*(threshold/100))

   resttest=0
   for y = i to lookback do
    resttest = resttest + (top[y]<hhtop and top[y]>lltop)
    if resttest>=minPoint then
     //drawarrowdown(barindex[i],topdata) coloured(255,0,0)
     drawsegment(barindex[lookback],topdata,barindex[1],topdata) coloured(255,0,0)
     break
    endif
   next
  endif
 endif
 if showSupport then
  //new through
  if t[i] then
   data = bottom[i]
   hh = data+(customclose[i]*(threshold/100))
   ll = data-(customclose[i]*(threshold/100))

   suptest=0
   for y = i to lookback do
    suptest = suptest + (bottom[y]<hh and bottom[y]>ll)
    if suptest>=minPoint then
     //drawarrowup(barindex[i],data) coloured(0,255,0)
     drawsegment(barindex[lookback],data,barindex[1],data) coloured(0,255,0)
     break
    endif
   next
  endif
 endif
next

hprice = highest[lookback](customclose)
lprice = lowest[lookback](customclose)
drawsegment(barindex[lookback],hprice,barindex,hprice)
drawsegment(barindex[lookback],lprice,barindex,lprice)

return
Download
Filename:
PRC_ZigZag-SupDem.itf
Downloads:
825
Master
I created ProRealCode because I believe in the power of shared knowledge. I spend my time coding new tools and helping members solve complex problems.
If you are stuck on a code or need a fresh perspective on a strategy, I am always willing to help. Welcome to the community!
Author’s Profile
Loading...