

Zigzag & Fibonacci Levels: Indicator for Detecting Key Market Levels
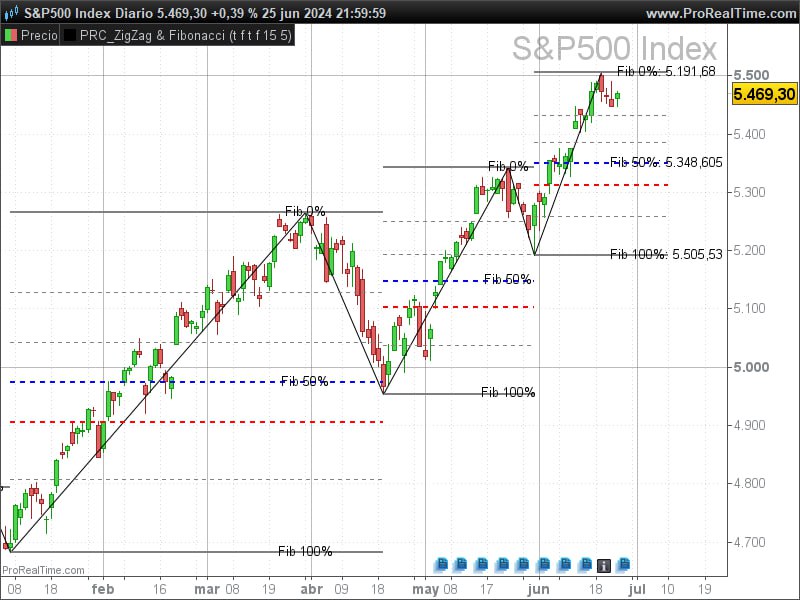
The Zigzag & Fibonacci Levels indicator is a powerful tool that combines the identification of market reversal points through the Zigzag and the projection of Fibonacci levels to anticipate possible support and resistance zones.
This article explores in detail how this indicator works, how to configure it, and how it can benefit traders in their technical analysis.
Description of the Zigzag Indicator
The Zigzag indicator is fundamental in technical analysis for identifying trend changes by eliminating market “noise.” This indicator draws lines that connect significant high and low points, filtering minor movements based on a percentage variation or absolute highest or lowest value.
Key Parameters:
- ZZpercent: Defines the method of Zigzag calculation (percentage or value).
- prd: Period for calculating high and low values.
- percent: Percentage change for Zigzag in percentage mode.
// Inputs
ZZpercent=1
prd=15
percent=5
Calculation of Pivots High & Low
The indicator identifies high (pivots high) and low (pivots low) points in two ways:
- Percent Mode: Uses percentage variation to determine pivots.
- Value Mode: Uses the highest and lowest values over a specified period (prd).
if ZZpercent then
    zz = zigzag[percent](close)
    ph = zz<zz[1] and zz[1]>zz[2]
    pl = zz>zz[1] and zz[1]<zz[2]
else
    ph = high=highest[prd](high)
    pl = low=lowest[prd](low)
endif
Calculation of Direction and Direction Changes
Once the pivots are identified, the indicator determines the current trend direction:
- dir = 1 indicates an uptrend.
- dir = -1 indicates a downtrend.
if ph and pl=0 then
    dir=1
elsif pl and ph=0 then
    dir=-1
else
    dir=dir
endif
dirchanged=dir<>dir[1]
Arrays for Each Pivot
The indicator stores the pivots and their direction in arrays, allowing precise tracking of the Zigzag points:
if ph or pl then
    if dirchanged then
        if dir=1 and not ZZpercent then
            $zigzag[t+1]=highest[prd](high)
            $zigzagidx[t+1]=barindex
            $dir[t+1]=1
            t=t+1
        elsif dir=-1 and not ZZpercent then
            $zigzag[t+1]=lowest[prd](low)
            $zigzagidx[t+1]=barindex
            $dir[t+1]=-1
            t=t+1
        elsif dir=1 and ZZpercent then
            $zigzag[t+1]=zz[1]
            $zigzagidx[t+1]=barindex[1]
            $dir[t+1]=1
            t=t+1
        elsif dir=-1 and ZZpercent then
            $zigzag[t+1]=zz[1]
            $zigzagidx[t+1]=barindex[1]
            $dir[t+1]=-1
            t=t+1
        endif
    else
        if not ZZpercent then
            if dir=1 and highest[prd](high)> $zigzag[t] then
                $zigzag[t]=highest[prd](high)
                $zigzagidx[t]=barindex
            elsif dir=-1 and lowest[prd](low)< $zigzag[t] then
                $zigzag[t]=lowest[prd](low)
                $zigzagidx[t]=barindex
            endif
        endif
    endif
endif
Drawing Zigzag Segments and Fibonacci Levels
The indicator draws the Zigzag segments and calculates the Fibonacci levels based on the trend direction:
if islastbarupdate then
    drawsegment($zigzagidx[max(0,t-1)],$zigzag[max(0,t-1)],$zigzagidx[t],$zigzag[t])
    if $dir[t]=1 then
        fib0=$zigzag[max(0,t-1)]
        fib100=$zigzag[t]
        diff=fib100-fib0
        fib0236=fib100-diff*0.236
        fib0382=fib100-diff*0.382
        fib0500=fib100-diff*0.500
        fib0618=fib100-diff*0.618
        fib0786=fib100-diff*0.786
        drawsegment($zigzagidx[max(0,t-1)],fib0,barindex+10,fib0)style(line,2)coloured("grey")
        drawsegment($zigzagidx[max(0,t-1)],fib0236,barindex+10,fib0236)style(dottedline,1)coloured("grey")
        drawsegment($zigzagidx[max(0,t-1)],fib0382,barindex+10,fib0382)style(dottedline,1)coloured("grey")
        drawsegment($zigzagidx[max(0,t-1)],fib0500,barindex+10,fib0500)style(dottedline,2)coloured("blue")
        drawsegment($zigzagidx[max(0,t-1)],fib0618,barindex+10,fib0618)style(dottedline,2)coloured("red")
        drawsegment($zigzagidx[max(0,t-1)],fib0786,barindex+10,fib0786)style(dottedline,1)coloured("grey")
        drawsegment($zigzagidx[max(0,t-1)],fib100,barindex+10,fib100)style(line,2)coloured("grey")
        drawtext("Fib 0%: #fib0#",barindex+10,fib100+0.05*atr)
        drawtext("Fib 50%: #fib0500#",barindex+10,fib0500+0.05*atr)
        drawtext("Fib 100%: #fib100#",barindex+10,fib0+0.05*atr)
    elsif $dir[t]=-1 then
        fib0=$zigzag[t]
        fib100=$zigzag[max(0,t-1)]
        diff=fib100-fib0
        fib0236=fib0+diff*0.236
        fib0382=fib0+diff*0.382
        fib0500=fib0+diff*0.500
        fib0618=fib0+diff*0.618
        fib0786=fib0+diff*0.786
        drawsegment($zigzagidx[max(0,t-1)],fib0,barindex+10,fib0)style(line,2)coloured("grey")
        drawsegment($zigzagidx[max(0,t-1)],fib0236,barindex+10,fib0236)style(dottedline,1)coloured("grey")
        drawsegment($zigzagidx[max(0,t-1)],fib0382,barindex+10,fib0382)style(dottedline,1)coloured("grey")
        drawsegment($zigzagidx[max(0,t-1)],fib0500,barindex+10,fib0500)style(dottedline,2)coloured("blue")
        drawsegment($zigzagidx[max(0,t-1)],fib0618,barindex+10,fib0618)style(dottedline,2)coloured("red")
        drawsegment($zigzagidx[max(0,t-1)],fib0786,barindex+10,fib0786)style(dottedline,1)coloured("grey")
        drawsegment($zigzagidx[max(0,t-1)],fib100,barindex+10,fib100)style(line,2)coloured("grey")
        drawtext("Fib 0%: #fib0#",barindex+10,fib0+0.05*atr)
        drawtext("Fib 50%: #fib0500#",barindex+10,fib0500+0.05*atr)
        drawtext("Fib 100%: #fib100#",barindex+10,fib100+0.05*atr)
    endif
endif
Visualization Configuration
The indicator allows customizing the visualization of past Fibonacci levels and adjusting the colors and styles of the lines for better visual interpretation.
Conclusion
The Zigzag & Fibonacci Levels indicator combines two powerful tools of technical analysis to provide a clear view of key market levels. By using this indicator, traders can more accurately identify reversal points and anticipate possible support and resistance zones.
ZigZag & Fibonacci Levels Code:
//----------------------------------------------------------------------------//
//PRC_ZigZag & Fibonacci levels
//version = 0
//26.06.24
//Iván González @ www.prorealcode.com
//Sharing ProRealTime knowledge
//----------------------------------------------------------------------------//
//-----Inputs-----------------------------------------------------------------//
ZZpercent=1 //Boolean//Method for pivot points calculation
prd=15 //Periods for Donchian Channel and pivot calculation
percent=5 //Percentage for zigzag calculation

showpastFib=1 //Boolean//shows all zigzag and Fibo levels
showDN=1 //Boolean//shows fibo levels in a Uptrend
ShowUP=0 //Boolean//shows fibo levels in a Downtrend
//----------------------------------------------------------------------------//
atr=averagetruerange[14](close) //Only drawing porpouse
//----------------------------------------------------------------------------//
//-----Pivots High&Low--------------------------------------------------------//
if ZZpercent then
//-----Mode Percent--------------------------------------------------------//
zz = zigzag[percent](close)
ph = zz<zz[1] and zz[1]>zz[2]
pl = zz>zz[1] and zz[1]<zz[2]
//-----Mode Highest/lowest Values------------------------------------------//
else
ph = high=highest[prd](high)
pl = low=lowest[prd](low)
endif
//----------------------------------------------------------------------------//
//-----Direction Calculation--------------------------------------------------//
if ph and pl=0 then
dir=1
elsif pl and ph=0 then
dir=-1
else
dir=dir
endif

dirchanged=dir<>dir[1]
//----------------------------------------------------------------------------//
//-----Calculate Arrays for each pivot----------------------------------------//
if ph or pl then
if dirchanged then
if dir=1 and not ZZpercent then
$zigzag[t+1]=highest[prd](high)
$zigzagidx[t+1]=barindex
$dir[t+1]=1
t=t+1
elsif dir=-1 and not ZZpercent then
$zigzag[t+1]=lowest[prd](low)
$zigzagidx[t+1]=barindex
$dir[t+1]=-1
t=t+1
elsif dir=1 and ZZpercent then
$zigzag[t+1]=zz[1]
$zigzagidx[t+1]=barindex[1]
$dir[t+1]=1
t=t+1
elsif dir=-1 and ZZpercent then
$zigzag[t+1]=zz[1]
$zigzagidx[t+1]=barindex[1]
$dir[t+1]=-1
t=t+1
endif
else
if not ZZpercent then
if dir=1 and highest[prd](high)> $zigzag[t] then
$zigzag[t]=highest[prd](high)
$zigzagidx[t]=barindex
elsif dir=-1 and lowest[prd](low)< $zigzag[t] then
$zigzag[t]=lowest[prd](low)
$zigzagidx[t]=barindex
endif
endif
endif
endif
//----------------------------------------------------------------------------//
//-----Drawing conditions-----------------------------------------------------//
if islastbarupdate then
//-----Last Zig and Fibonacci Levels---------------------------------------//
drawsegment($zigzagidx[max(0,t-1)],$zigzag[max(0,t-1)],$zigzagidx[t],$zigzag[t])
if $dir[t]=1 then
//-----Calculation when trend Up----------------------------------------//
fib0=$zigzag[max(0,t-1)]
fib100=$zigzag[t]
diff=fib100-fib0
fib0236=fib100-diff*0.236
fib0382=fib100-diff*0.382
fib0500=fib100-diff*0.500
fib0618=fib100-diff*0.618
fib0786=fib100-diff*0.786
drawsegment($zigzagidx[max(0,t-1)],fib0,barindex+10,fib0)style(line,2)coloured("grey")
drawsegment($zigzagidx[max(0,t-1)],fib0236,barindex+10,fib0236)style(dottedline,1)coloured("grey")
drawsegment($zigzagidx[max(0,t-1)],fib0382,barindex+10,fib0382)style(dottedline,1)coloured("grey")
drawsegment($zigzagidx[max(0,t-1)],fib0500,barindex+10,fib0500)style(dottedline,2)coloured("blue")

drawsegment($zigzagidx[max(0,t-1)],fib0618,barindex+10,fib0618)style(dottedline,2)coloured("red")
drawsegment($zigzagidx[max(0,t-1)],fib0786,barindex+10,fib0786)style(dottedline,1)coloured("grey")
drawsegment($zigzagidx[max(0,t-1)],fib100,barindex+10,fib100)style(line,2)coloured("grey")
drawtext("Fib 0%: #fib0#",barindex+10,fib100+0.05*atr)
drawtext("Fib 50%: #fib0500#",barindex+10,fib0500+0.05*atr)
drawtext("Fib 100%: #fib100#",barindex+10,fib0+0.05*atr)
elsif $dir[t]=-1 then
//-----Calculation when trend Down--------------------------------------//
fib0=$zigzag[t]
fib100=$zigzag[max(0,t-1)]
diff=fib100-fib0
fib0236=fib0+diff*0.236
fib0382=fib0+diff*0.382
fib0500=fib0+diff*0.500
fib0618=fib0+diff*0.618
fib0786=fib0+diff*0.786
drawsegment($zigzagidx[max(0,t-1)],fib0,barindex+10,fib0)style(line,2)coloured("grey")
drawsegment($zigzagidx[max(0,t-1)],fib0236,barindex+10,fib0236)style(dottedline,1)coloured("grey")
drawsegment($zigzagidx[max(0,t-1)],fib0382,barindex+10,fib0382)style(dottedline,1)coloured("grey")
drawsegment($zigzagidx[max(0,t-1)],fib0500,barindex+10,fib0500)style(dottedline,2)coloured("blue")
drawsegment($zigzagidx[max(0,t-1)],fib0618,barindex+10,fib0618)style(dottedline,2)coloured("red")
drawsegment($zigzagidx[max(0,t-1)],fib0786,barindex+10,fib0786)style(dottedline,1)coloured("grey")
drawsegment($zigzagidx[max(0,t-1)],fib100,barindex+10,fib100)style(line,2)coloured("grey")
drawtext("Fib 0%: #fib0#",barindex+10,fib0+0.05*atr)
drawtext("Fib 50%: #fib0500#",barindex+10,fib0500+0.05*atr)
drawtext("Fib 100%: #fib100#",barindex+10,fib100+0.05*atr)
endif
//-----Draw all Fibonacci levels and ZigZag-----------------------------------------//
if showpastFib then
for i=t-1 downto 1 do
//----------------------------------------------------------------------------//
drawsegment($zigzagidx[max(0,i-1)],$zigzag[max(0,i-1)],$zigzagidx[i],$zigzag[i])
//-----Show Fibonacci when trend Up-------------------------------------------//
if $dir[i]=1  and showDN then
fib0=$zigzag[i-1]
fib100=$zigzag[i]
diff=fib100-fib0
fib0236=fib100-diff*0.236
fib0382=fib100-diff*0.382
fib0500=fib100-diff*0.500
fib0618=fib100-diff*0.618
fib0786=fib100-diff*0.786
drawsegment($zigzagidx[i-1],fib0,$zigzagidx[i+1],fib0)style(line,2)coloured("grey")
drawsegment($zigzagidx[i-1],fib0236,$zigzagidx[i+1],fib0236)style(dottedline,1)coloured("grey")
drawsegment($zigzagidx[i-1],fib0382,$zigzagidx[i+1],fib0382)style(dottedline,1)coloured("grey")
drawsegment($zigzagidx[i-1],fib0500,$zigzagidx[i+1],fib0500)style(dottedline,2)coloured("blue")
drawsegment($zigzagidx[i-1],fib0618,$zigzagidx[i+1],fib0618)style(dottedline,2)coloured("red")
drawsegment($zigzagidx[i-1],fib0786,$zigzagidx[i+1],fib0786)style(dottedline,1)coloured("grey")
drawsegment($zigzagidx[i-1],fib100,$zigzagidx[i+1],fib100)style(line,2)coloured("grey")
drawtext("Fib 0%",$zigzagidx[i],fib100+0.05*atr)
drawtext("Fib 50%",$zigzagidx[i],fib0500+0.05*atr)
drawtext("Fib 100%",$zigzagidx[i],fib0+0.05*atr)
//-----Show Fibonacci when trend Down-----------------------------------------//
elsif $dir[i]=-1 and ShowUP then
fib0=$zigzag[i]
fib100=$zigzag[i-1]
diff=fib100-fib0
fib0236=fib0+diff*0.236
fib0382=fib0+diff*0.382
fib0500=fib0+diff*0.500
fib0618=fib0+diff*0.618
fib0786=fib0+diff*0.786
drawsegment($zigzagidx[i-1],fib0,$zigzagidx[i+1],fib0)style(line,2)coloured("grey")
drawsegment($zigzagidx[i-1],fib0236,$zigzagidx[i+1],fib0236)style(dottedline,1)coloured("grey")
drawsegment($zigzagidx[i-1],fib0382,$zigzagidx[i+1],fib0382)style(dottedline,1)coloured("grey")
drawsegment($zigzagidx[i-1],fib0500,$zigzagidx[i+1],fib0500)style(dottedline,2)coloured("blue")
drawsegment($zigzagidx[i-1],fib0618,$zigzagidx[i+1],fib0618)style(dottedline,2)coloured("red")
drawsegment($zigzagidx[i-1],fib0786,$zigzagidx[i+1],fib0786)style(dottedline,1)coloured("grey")
drawsegment($zigzagidx[i-1],fib100,$zigzagidx[i+1],fib100)style(line,2)coloured("grey")
drawtext("Fib 0%",$zigzagidx[i],fib0+0.05*atr)
drawtext("Fib 50%",$zigzagidx[i],fib0500+0.05*atr)
drawtext("Fib 100%",$zigzagidx[i],fib100+0.05*atr)
endif
next
endif
endif
return
