

ZiBoll Style Execution
February 20, 2020, 3:46 PM
Indicators
4 Comments
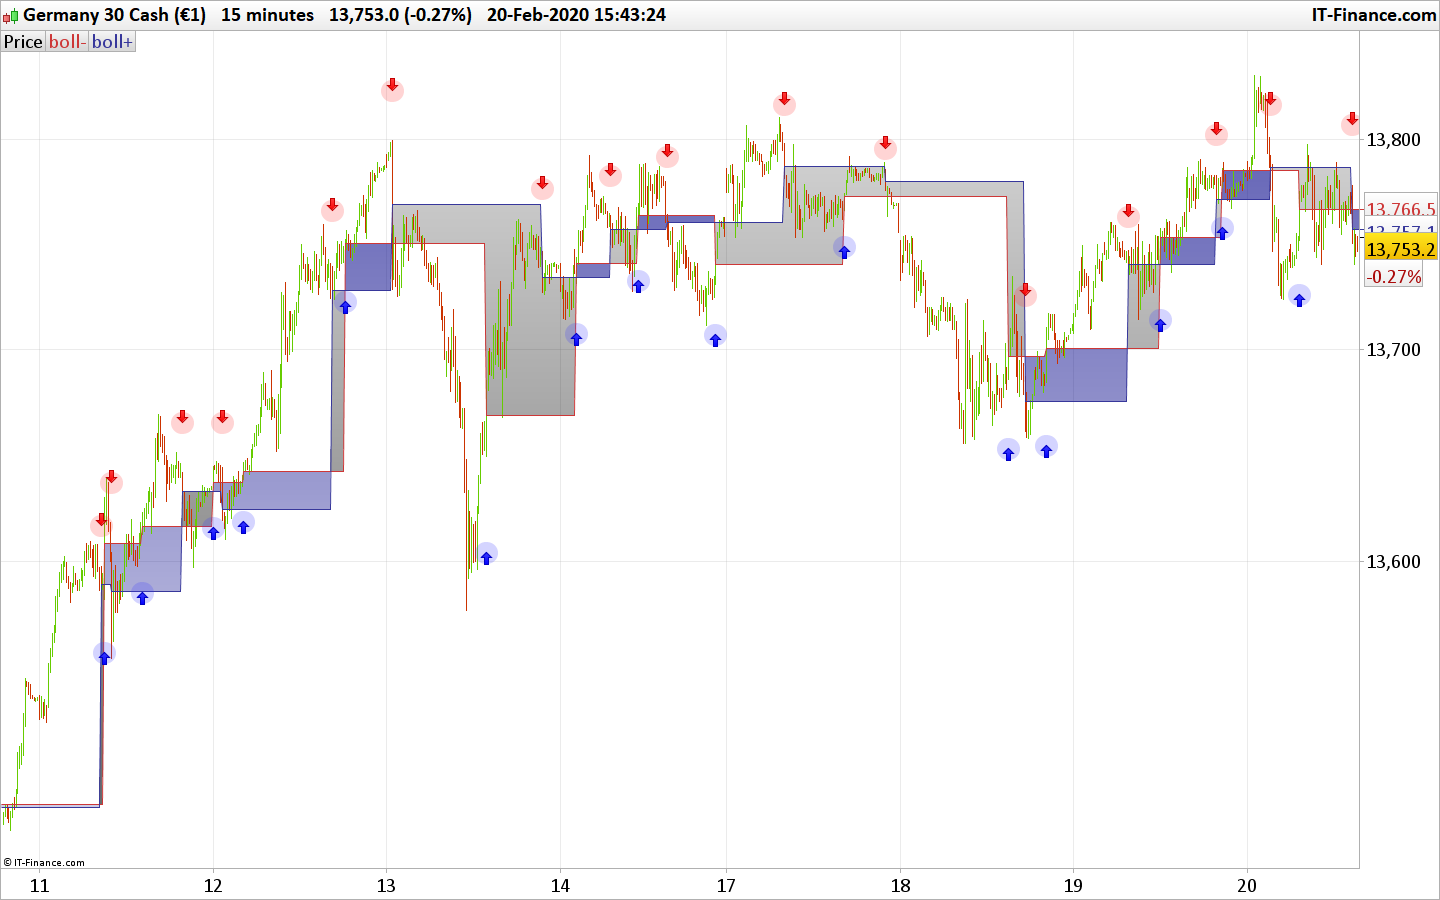
The ZiBoll Style Indicator is based on special view of the bollinger bands. The bollinger values are computed with the help of a weighted average of the Low’s and of the High’s.
When those MA’s are computed , they where compared with the close to create a Boolean result.
Signals are given by red and blue arrows. (arrows into red and blue circles). Compare with the backtest arrows, it don’t fit. I like to discuss this matter.
// Settings

Once p = 20
Once s = 0.5

// Computes the basic moving average from the low and from the high

BollMALow = WeightedAverage[p](Low)
BollMAHigh= Weightedaverage[p](High)

// Computes the Standard Deviation (You can also take fx for colculate the "StdSTD[20](close)")

IF barindex >= p-1 THEN
sumy2 = 0
sumy = 0
FOR i = 0 TO p-1 do
sumy2 = sumy2 + SQUARE(close[i])
sumy = sumy + close[i]
NEXT
STDDEV =SQRT(sumy2 / p - SQUARE(sumy / p))
ELSE
STDDEV = undefined
ENDIF

//Compute the Special Bollinger Bands.
//Instead of two times the STDDEV we calculate 0.5 times the STDDEV , and subtract it from the LowMA
//For the upper value we take 0.5 times the STDDEV and add it to the HighMA

BdnL = BollMALow - (s * STDDEV)
buph = bollmahigh + (s * STDDEV)

//Compare the results with the close of each candle
//Lower than the close its -1
//Higher than the close its +1
//Between the two values equals the previous values

if close < BdnL then
ZHL=-1
elsif close > Buph then
ZHL=1
else
ZHL=ZHL[1]
endif

//The Boolean value of ZHL

if ZHL crosses over 0 then
Dnh=Buph
drawtext("●",barindex,low-2*AverageTrueRange[14](close),Dialog,Bold,30) coloured(55,55,255,55)
DRAWARROWUP(barindex, low-2*AverageTrueRange[14](close))coloured(0,0,255,255)
endif
if ZHL crosses under 0 then
Uph=Bdnl
drawtext("●",barindex,high+2*AverageTrueRange[14](close),Dialog,Bold,30) coloured(255,55,55,55)
DRAWARROWDOWN(barindex, high+2*AverageTrueRange[14](close))coloured(255,0,0,255)
endif

RETURN dnh coloured(205,55,55,255) as"boll-" , uph coloured(55,55,155,255)as"boll+"
Download
Filename:
ZiBoll-Style-Execution.itf
Downloads:
479
Master
This author is like an anonymous function, present but not directly identifiable. More details on this code architect as soon as they exit 'incognito' mode.
Author’s Profile
Loading...