

Z-ichimoku
April 23, 2020, 1:39 PM
Indicators
2 Comments
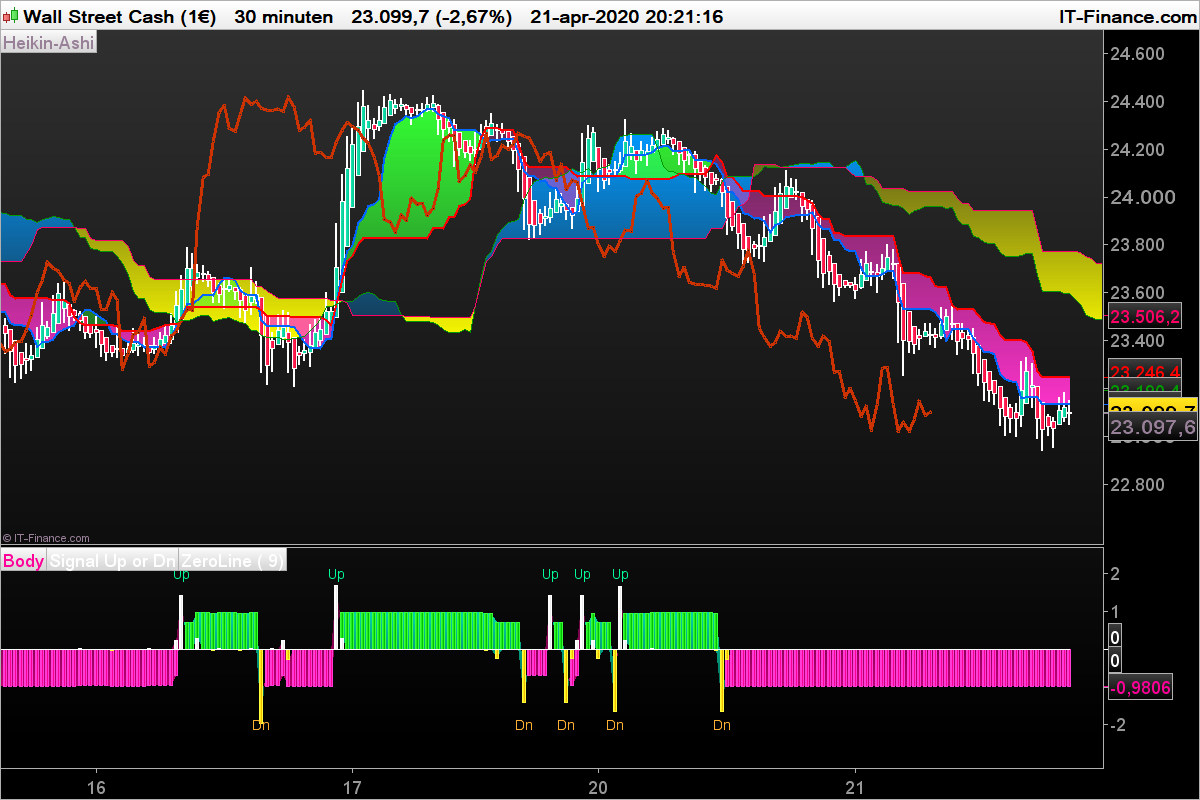
I have tried to visualise ichimoku without disturbing the main chart. I worked with the Sin(atan(5)) by creating 5 different conditions.
All the conditions are tested as Boolean conditions (+1) or (-1) and totalized as a single histogram.
So we have 6 possible results. 4 of 6 conditions are relevant the other two are weak, not completed or floating and therefore ignored.
// 21 april 2020
// Ichimoku Digital by Zigo
//
once a=9
once n=a
once m=3*n-1

TS= (highest[n](high)+lowest[n](low))/2
KS=(highest[m](high)+lowest[m](low))/2
SpanA=(TS+KS)/2
SpanB=(highest[2*m](high)+lowest[2*m](low))/2
C=close
CS=close[m]
//Conditie 1
if TS >= KS  Then
Cond1=1
elsif TS <= KS then
cond1=-1
endif
//Conditie 2
if C>= CS then
cond2=1
elsif C <= cS then
cond2 =-1
endif
//Conditie 3
if c >= (spanA[26] + SpanB[26])/2 then
cond3=1
elsif c <= (SpanA[26] + SpanB[26])/2 then
cond3 = -1
endif
//Conditie 4
if ts > (SpanA + SpanB)/2 then
cond4= 1
elsif ts < (spanA + SpanB)/2 then
cond4=-1
endif
//Conditie 5
if ts > SpanB then
cond5= 1
elsif ts <spanB then
cond5=-1
endif

Ichi = sin(atan(cond1 + cond2 +cond3 + cond4 + cond5))
c7=Ichi - ichi[1]
if c7 > 0.70711 then
DRAWTEXT("Up", barindex, 2, dialog,standard,14)coloured(0,255,153,255)
elsif c7 < -0.70711 then
DRAWTEXT("Dn", barindex, -2, dialog, standard, 14)coloured(255, 175, 51)
endif
return  ichi as "Body", c7 as"Signal Up or Dn", 0 as"ZeroLine"
Download
Filename:
Z-Ichimoku.itf
Downloads:
394
Master
As an architect of digital worlds, my own description remains a mystery. Think of me as an undeclared variable, existing somewhere in the code.
Author’s Profile
Loading...