

XO indicator
October 17, 2017, 4:32 PM
Indicators
0 Comments
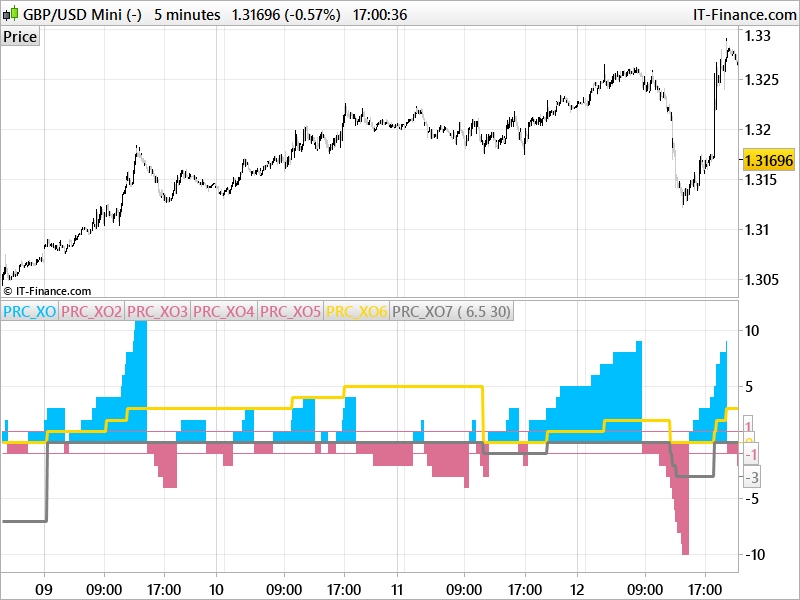
The “XO” indicator is counting the price movement calculated by box sizes of 2 different sizes.
The histogram of the indicator display a count of how many boxes of “BoxSize1” the price has moved, while the lines display the price movement of “BoxSize2”. It is almost similar to count how many renko bricks has been created upside or downside.
So you have a view of a “long term” trend and the short one in the same indicator.
Indicator converted from a request in the English indicator forum.
//PRC_XO | indicator
//16.10.2017
//Nicolas @ www.prorealcode.com
//Sharing ProRealTime knowledge
//converted from MT4 version (original author mladen)

// --- settings
//BoxSize1 = 6.5 // First box size
//BoxSize2 = 30.0 // Second box size
// --- end of settings

BoxPrice = customclose // Price to use for box calculation

cur=BoxPrice
once hi1=cur
once hi2=cur
once lo1=cur
once lo2=cur

if (cur > (hi1+BoxSize1*Pointsize)) then
 hi1 = cur
 lo1 = cur-BoxSize1*Pointsize
 kr1 = kr1+1
 no1 = 0
endif
if (cur < (lo1-BoxSize1*Pointsize)) then
 lo1 = cur
 hi1 = cur+BoxSize1*pointsize
 no1 = no1-1
 kr1 = 0
endif
if (cur > (hi2+BoxSize2*pointsize)) then
 hi2 = cur
 lo2 = cur-BoxSize1*pointsize
 kr2 = kr2+1
 no2 = 0
endif
if (cur < (lo2-BoxSize2*pointsize)) then
 lo2 = cur
 hi2 = cur+BoxSize1*pointsize
 no2 = no2-1
 kr2 = 0
endif

return kr1 coloured(0,191,255) style(histogram),no1 coloured(219,112,147) style(histogram), 0 coloured(219,112,147) style(dottedline), 1 coloured(219,112,147) style(line), -1 coloured(219,112,147) style(line), kr2 coloured(255,215,0) style(line,3),no2 coloured(128,128,128) style(line,3)
Download
Filename:
PRC_XO.itf
Downloads:
348
Master
I created ProRealCode because I believe in the power of shared knowledge. I spend my time coding new tools and helping members solve complex problems.
If you are stuck on a code or need a fresh perspective on a strategy, I am always willing to help. Welcome to the community!
Author’s Profile
Loading...