

Wick to Body Ratio Trend Forecast
1) One-line summary
This indicator (by Fluxchart) compares the wick-to-body ratio of the latest candle to historical analogues and projects an average forward path on your chart, color-coding each forecast step by dispersion/confidence.
2) The problem it solves (TL;DR)
Candlestick wicks vs bodies often reveal imbalance between aggressive and passive flows. Instead of reading a single candle in isolation, this tool hunts the past for candles with similar wick/body structure, then projects the typical path that followed comparable setups—giving you a data-driven, visual “what usually happens next” for the next N bars.
3) How it works — intuition
- Compute a ratio per candle that encodes wick/body relationships (four modes available).
- Find historical candles whose ratio is sufficiently close to the current one (optionally only same bullish/bearish direction).
- For each match, take the price trajectory around the match (see “Algorithm details”) and average those trajectories to draw a forecast line ahead of the current bar.
- Use dispersion (standard deviation) among matched paths to color each segment: tighter agreement ⇒ lower dispersion; wider disagreement ⇒ higher dispersion.
Practical read: the slope of the projected line suggests likely path; the color hints at confidence.
4) The four ratio modes (when to use which)
- General Ratio (default)
Compares total wick length to body, signed by candle direction.
Use it for a balanced, all-purpose analogue search. - Top Wick Ratio
Focuses on the upper wick relative to body, signed by direction.
Use it when upper rejections/exhaustion (selling into highs) are central to your thesis. - Bottom Wick Ratio
Focuses on the lower wick relative to body, signed by direction.
Use it for hammer-type absorption or lower-shadow demand clues. - Body Ratio
Body vs full range.
Use it to emphasize closing strength within the bar’s range (breakout/drive conditions).
5) Inputs & defaults (cheat sheet)
| Input | Default | What it does | Typical tweaks |
|---|---|---|---|
loopback |
400 | How many past bars to scan for analogues. | 200–1000 depending on timeframe/market history. |
forecast |
10 | Number of forecast bars to draw ahead. | 5 (scalping) to 20 (swing). |
ratioType |
1 | 1=General, 2=Top Wick, 3=Bottom Wick, 4=Body. | Switch per setup hypothesis. |
directionBias |
1 | If 1, only compare candles with the same direction (bull/bear). | Set 0 to allow cross-direction analogues. |
defaultAccuracy |
2 | Initial tolerance for ratio matching: 1=High (strict), 2=Medium, 3=Low (loose). | Tighten for clean regimes; loosen in noisy ones. |
deviationHigh(R,G,B) |
255,0,0 | Color when dispersion is high (lower confidence). | Adjust to your palette. |
deviationLow(R,G,B) |
0,0,255 | Color when dispersion is low (higher confidence). | Adjust to your palette. |
trendSquare |
1 | Draw a box around each matched analogue window. | Turn off for a cleaner chart. |
trendSquareLabels |
1 | Show ratio labels for current & matched candles. | Useful for debugging/tuning. |
displayLogs |
1 | Show on-chart warnings (e.g., no matches). | Keep on while calibrating. |
Note on colors: by default blue = lower dispersion (higher agreement), red = higher dispersion (lower agreement).
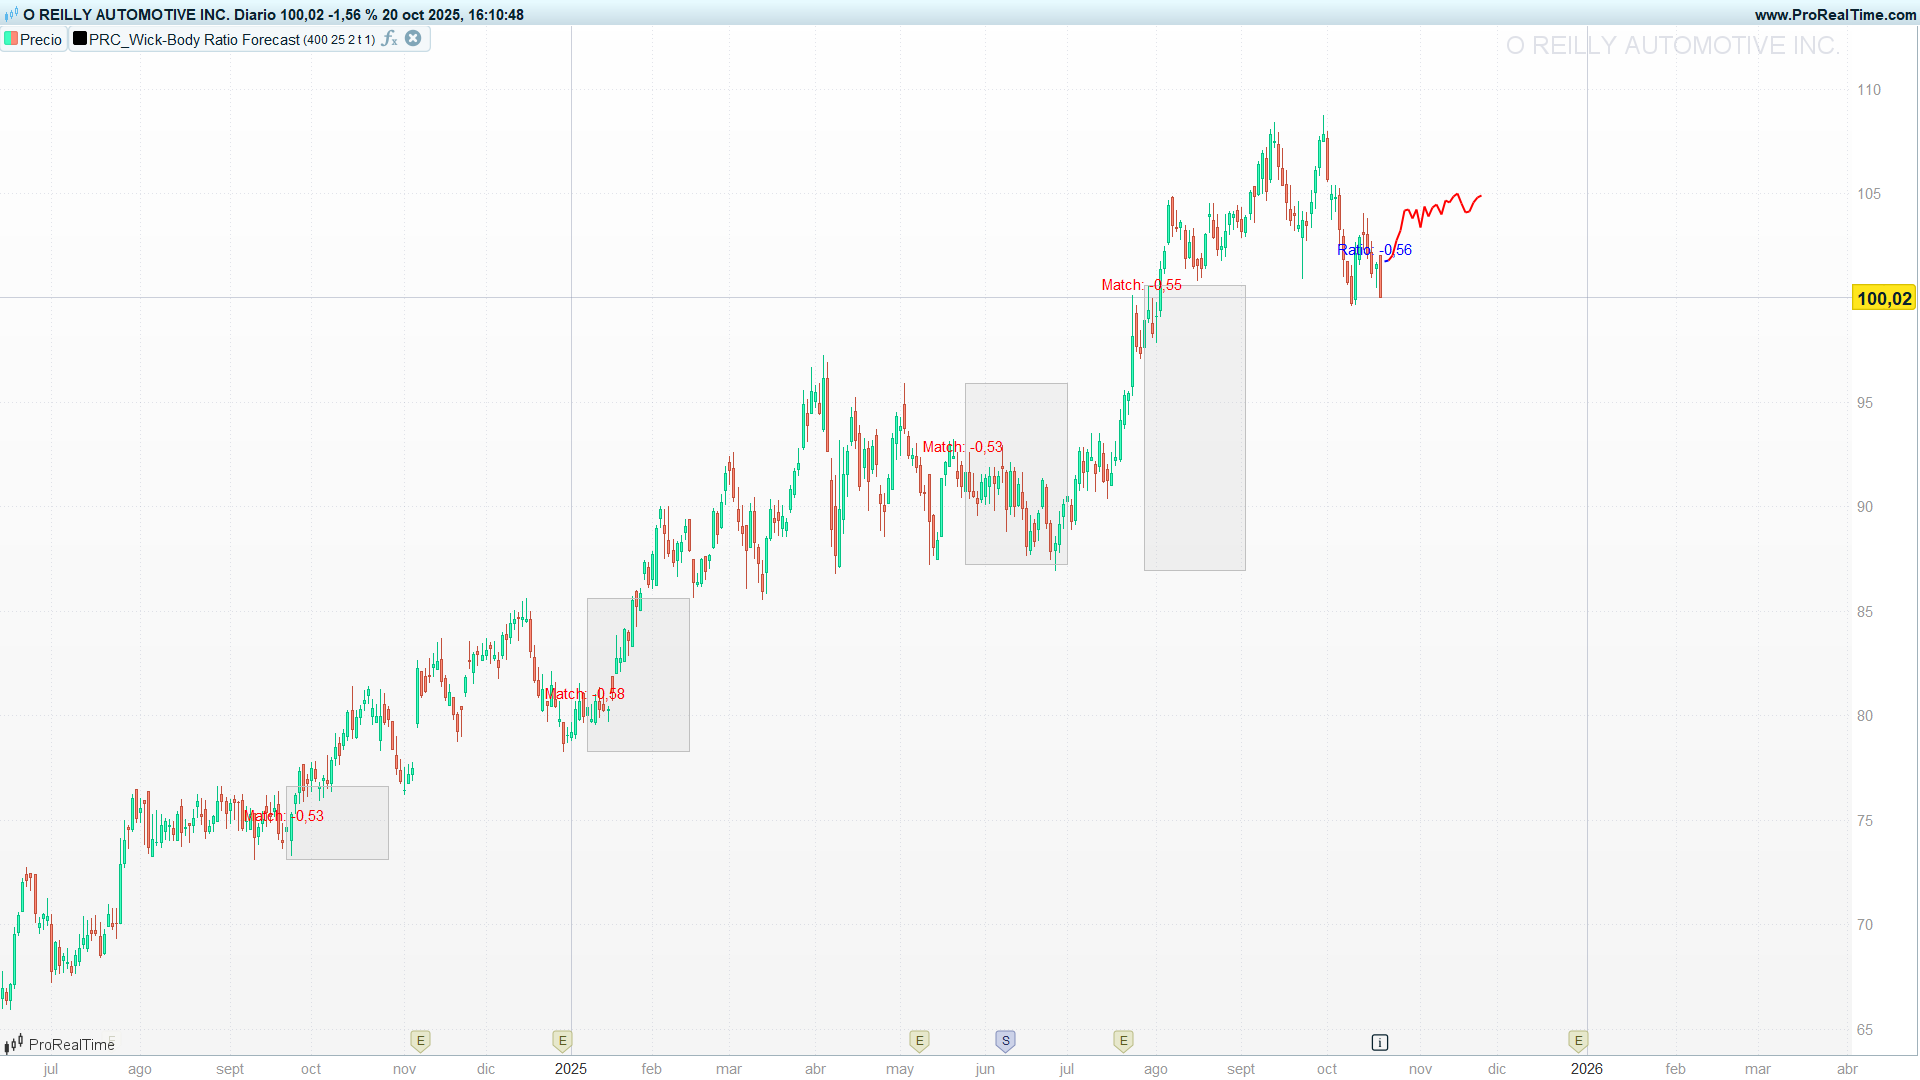
6) What you’ll see on the chart
- Forecast polyline ahead of the last bar: one segment per future step up to
forecast. - Color per segment from dispersion: blue ≈ more agreement among matches; red ≈ less.
- Boxes around historical analogue windows (if enabled), so you can visually audit what the indicator considered “similar.”
- Text labels with the computed ratio for the current bar and each match (if enabled).
7) Algorithm walkthrough (step by step)
- Compute the ratio & sign
- Based on
ratioType, the indicator calculatesmyRatiousing OHLC and assigns a sign from candle direction (bullish = +, bearish = −). - The General mode normalizes total wick vs body; Top/Bottom isolate upper/lower wick contributions; Body uses body vs full range.
- Based on
- Adaptive matching loop
- Start from an initial
accuracy(0.02, modified bydefaultAccuracy). - Scan up to
loopbackbars back. For each past bari, compare absolute ratios|myRatio[i]|vs|myRatio[1]|. - A match occurs if the difference ≤ accuracy and, when
directionBias=1, the sign matches. - The loop widens accuracy if < 5 matches, tightens if > 15; otherwise it accepts the set (guarded by a safety loop of 20 passes).
- If accuracy exceeds 0.10 with zero matches, a warning is displayed and the routine exits.
- Start from an initial
- Build the forecast path from analogues
- For each matched bar, the code aggregates relative price changes over the
forecastlength into arrays:
candleValue = close[i - y - 1] - close[i]for y = 0…forecast-1. - Those values are averaged across matches to obtain an average trajectory
avgCurrent,avgNext.
Implementation nuance: the indicator projects forward the average pre-move path around each analogue, applied from today’s close. In practice, this works like a pattern-shape template.
- For each matched bar, the code aggregates relative price changes over the
- Confidence via dispersion
- It computes a standard deviation for each step from the sums of squares, and toggles the color:
low dispersion ⇒deviationLow(default blue), high dispersion ⇒deviationHigh(default red).
- It computes a standard deviation for each step from the sums of squares, and toggles the color:
- Draw it
- The forecast is drawn ahead of the last bar using
DRAWSEGMENT, fromclose[1] + avgCurrenttoclose[1] + avgNext, step by step.
- The forecast is drawn ahead of the last bar using
7) ProBuilder code
//-------------------------------------------//
//PRC_Wick to Body Ratio Trend Forecast by fluxchart
//version = 0
//14.10.2025
//Iván González @ www.prorealcode.com
//Sharing ProRealTime knowledge
//-------------------------------------------//
// --- ALGORITHM SETTINGS ---
// Number of candles to look back
loopback = 400
// Bar length of the forecast lines
forecast = 10
// Ratio Type to use: 1=General, 2=Top Wick, 3=Bottom Wick, 4=Body
ratioType = 1
// If 1, only candles of the same direction (bullish/bearish) are compared
directionBias = 1 // 1=true, 0=false
// Initial Accuracy: 1=High, 2=Medium, 3=Low
defaultAccuracy = 2

// --- FORECAST LINES ---
// High confidence color (R,G,B values)
deviationHighR = 255
deviationHighG = 0
deviationHighB = 0
// Low confidence color (R,G,B values)
deviationLowR = 0
deviationLowG = 0
deviationLowB = 255

// --- PAST TRENDS ---
// 1 = Draws a box around matching past trends
trendSquare = 1
// 1 = Labels the ratios of matching candles
trendSquareLabels = 1

// --- OTHER ---
// 1 = Displays warning messages on the chart
displayLogs = 1

// --- VARIABLE INITIALIZATION ---
ONCE accuracy = 0.02
IF defaultAccuracy = 1 THEN
   accuracy = 0.01
ELSIF defaultAccuracy = 3 THEN
   accuracy = 0.04
ENDIF

ONCE ratioNotFindable = 0
ONCE lastBar = 0
ONCE matchesFound = 0
ONCE loopBreaker = 0

// --- CANDLE RATIO CALCULATION ---
myRatio = 0
sign = 0
IF (close - open) > 0 THEN
   sign = 1
ELSIF (close - open) < 0 THEN
   sign = -1
ENDIF

// General Ratio
IF ratioType = 1 THEN
   IF ABS(close - open) > 0 THEN
      myRatio = ((ABS(low - high) - ABS(close - open)) / ABS(close - open)) * sign
   ELSE
      myRatio = 0
   ENDIF
   // Top Wick
ELSIF ratioType = 2 THEN
   IF ABS(close - open) > 0 THEN
      myRatio = ((MAX(close, open) - high) / ABS(close - open)) * sign
   ELSE
      myRatio = 0
   ENDIF
   // Bottom Wick
ELSIF ratioType = 3 THEN
   IF ABS(close - open) > 0 THEN
      myRatio = ((MIN(close, open) - low) / ABS(close - open)) * sign
   ELSE
      myRatio = 0
   ENDIF
   // Body Ratio
ELSIF ratioType = 4 THEN
   IF ABS(high - low) > 0 THEN
      myRatio = (ABS(close - open) / ABS(high - low)) * sign
   ELSE
      myRatio = 0
   ENDIF
ENDIF


// --- MAIN LOGIC (RUNS ON THE LAST BAR) ---
IF ISLASTBARUPDATE THEN

   // Clear arrays for new calculation
   UNSET($sumArray)
   UNSET($sumOfSquaresArray)

   // Label for the current candle's ratio
   IF trendSquareLabels = 1 THEN

      ratio = ROUND(myRatio[1]*100)/100
      DRAWTEXT("Ratio: #ratio#", barindex[1], high[1] + (high[1]-low[1])*0.5) COLOURED(0,0,255)
   ENDIF

   // Loop to adjust accuracy and find matches
   matchesFound = 0
   loopBreaker = 0
   WHILE loopBreaker < 20 DO // Safety loop to prevent infinite loops
      matchesFound = 0
      lastBar = 0

      // Reset accumulation arrays
      FOR f = 0 TO forecast - 1 DO
         $sumArray[f] = 0
         $sumOfSquaresArray[f] = 0
      NEXT

      // Main loop to search through historical data
      FOR i = forecast + lastBar TO (loopback + forecast) DO

         barsDifference = ABS(ABS(myRatio[i]) - ABS(myRatio[1]))

         ratioSignI = 0
         IF myRatio[i] > 0 THEN
            ratioSignI = 1
         ELSIF myRatio[i] < 0 THEN
            ratioSignI = -1
         ENDIF

         ratioSignCurrent = 0
         IF myRatio[1] > 0 THEN
            ratioSignCurrent = 1
         ELSIF myRatio[1] < 0 THEN
            ratioSignCurrent = -1
         ENDIF

         ratioDirectionMatch = (ratioSignI = ratioSignCurrent)

         IF (barsDifference <= accuracy AND ratioDirectionMatch) OR (barsDifference <= accuracy AND directionBias = 0) THEN
            matchesFound = matchesFound + 1

            // Accumulate values for the forecast
            FOR y = 0 TO forecast - 1 DO
               candleValue = close[i - y - 1] - close[i]
               $sumArray[y] = $sumArray[y] + candleValue
               $sumOfSquaresArray[y] = $sumOfSquaresArray[y] + POW(candleValue, 2)
            NEXT

            // Draw boxes and labels on past matches
            IF trendSquare = 1 OR trendSquareLabels = 1 THEN
               mytop = highest[forecast](high[i-1])
               mybottom = lowest[forecast](low[i-1])

               IF trendSquare = 1 THEN
                  DRAWRECTANGLE(barindex[i], mytop, barindex[i - forecast], mybottom) COLOURED(192,192,192)fillcolor(192,192,192,50)
               ENDIF

               IF trendSquareLabels = 1 THEN
                  directionColorR = 255
                  directionColorG = 0
                  IF myRatio[i] > 0 THEN
                     directionColorR = 0
                     directionColorG = 255
                  ENDIF
                  ratio = ROUND(myRatio[i]*100)/100
                  DRAWTEXT("Match: #ratio#", barindex[i], high[i] + (high[i]-low[i])*0.5) COLOURED(directionColorR, directionColorG, 0)
               ENDIF
            ENDIF

            // Update to avoid repeating the same candle (optimization)
            lastBar = i
         ENDIF
      NEXT

      // Accuracy adjustment logic
      IF matchesFound < 5 THEN
         accuracy = accuracy + 0.01
      ELSIF matchesFound > 15 THEN
         accuracy = accuracy - 0.005
      ELSE
         ratioNotFindable = 0
         BREAK // Exit the WHILE loop
      ENDIF

      IF accuracy > 0.1 AND matchesFound = 0 THEN
         ratioNotFindable = 1
         IF displayLogs = 1 THEN
            DRAWTEXT("WARNING: No matches found.", barindex - 50, high) ANCHOR(TOPLEFT, INDEX, YSHIFT) COLOURED(255,165,0)
         ENDIF
         BREAK
      ENDIF

      loopBreaker = loopBreaker + 1
   WEND

   // --- DRAWING THE FORECAST LINE ---
   IF ratioNotFindable = 0 AND matchesFound > 0 THEN
      deviation = (ArrayMax($sumArray)/matchesFound - ArrayMin($sumArray)/matchesFound) / 2

      FOR i = 0 TO forecast - 2 DO
         avgCurrent = $sumArray[i] / matchesFound
         avgNext = $sumArray[i+1] / matchesFound

         // Calculate standard deviation for color
         sumSqCurrent = $sumOfSquaresArray[i]
         stdevCurrent = SQRT((sumSqCurrent / matchesFound) - POW(avgCurrent, 2))

         // Simulate gradient color
         lineR = deviationLowR
         lineG = deviationLowG
         lineB = deviationLowB
         IF stdevCurrent > deviation / 2 THEN
            lineR = deviationHighR
            lineG = deviationHighG
            lineB = deviationHighB
         ENDIF

         // Draw a segment of the forecast line
         DRAWSEGMENT(barindex + i + 1, close[1] + avgCurrent, barindex + i + 2, close[1] + avgNext) STYLE(Line, 2) COLOURED(lineR, lineG, lineB)
      NEXT
   ENDIF
ENDIF

RETURN