Introduction
Wicks are the market’s fingerprints. A tall upper wick often tells you that buyers pushed into higher prices but were absorbed by aggressive sellers; a tall lower wick suggests the inverse—absorption by buyers at lower prices. The challenge is separating meaningful pressure from incidental noise and doing so consistently across instruments and timeframes.
Wick Pressure Zones (by Bigbeluga) solves this by transforming unusually large wicks into objective supply/demand areas. It normalizes each wick against the largest wick observed in a rolling window, applies a simple RSI regime filter for context, and then draws and extends those zones forward until price fully clears them. The result is a clean, rules‑based map of where pressure concentrated—and how the market later reacts on retests or breaks.
How it works
1) From wick to score
Each candle is decomposed into body and wicks: bodyTop = max(open, close) and bodyBot = min(open, close). Upper and lower wick lengths are measured relative to price to avoid unit bias and protected against division by zero with a small epsilon. Over the last lookback bars, the script tracks the maximum observed relative wick on each side. Every new wick is then scaled from 0 to 100 by dividing by that maximum and applying floor().
Why normalize? A 20‑tick wick on an index future may be huge on a 1‑minute chart and trivial on a daily chart. Normalization turns raw points into a comparable signal across contexts.
2) Birth conditions for a zone
A zone is created only when pressure is decisive and directional:
- For an upper (supply) zone, the upper‑wick score must be ≥
threshold, the lower side must not also exceed the threshold (to avoid ambiguous two‑sided spikes), andRSI[rsiLen] > 50to confirm upward pressure where sellers stepped in. - For a lower (demand) zone, the mirror logic applies with
RSI[rsiLen] < 50. extendBarsenforces a minimum spacing between zone births to prevent clustering.
At creation, the indicator stores each zone’s side, left/right anchors, top/bot prices, a broken flag, and the volume seen on the birth candle. To keep charts readable, only the most recent maxLevels zones are retained (oldest are shifted out).
3) Extension and invalidation
Active zones extend their right edge to the latest bar as the market trades. A zone flips to broken only when price fully clears it:
- An upper zone is cleared if a later bar has
low > top(the entire candle prints above the zone top). - A lower zone is cleared if a later bar has
high < bot(the entire candle prints below the zone bottom).
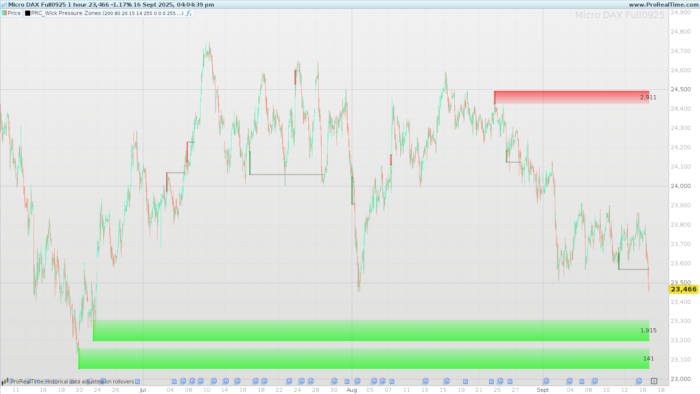
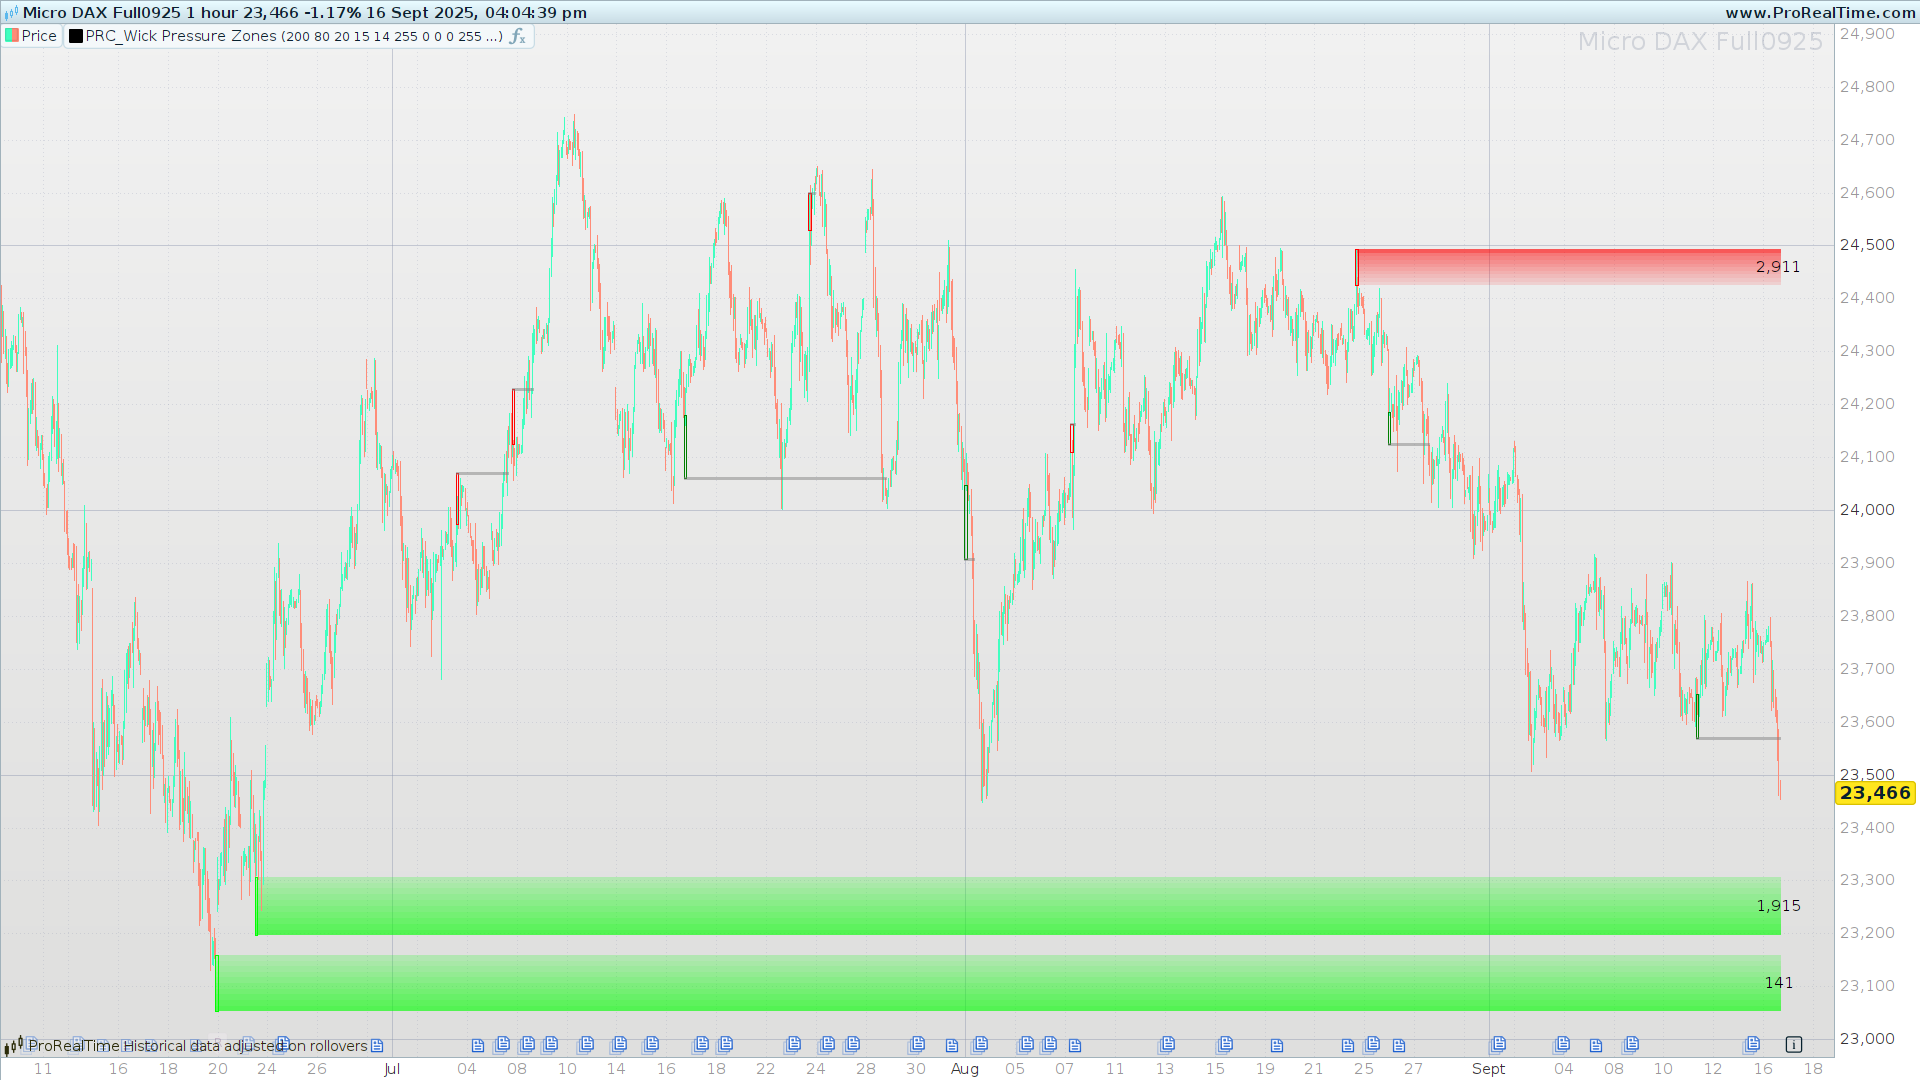
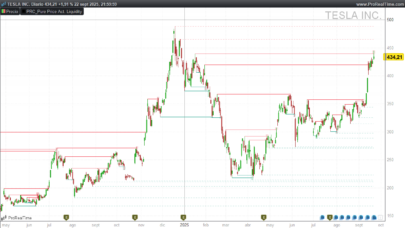
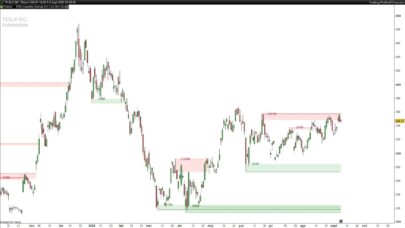
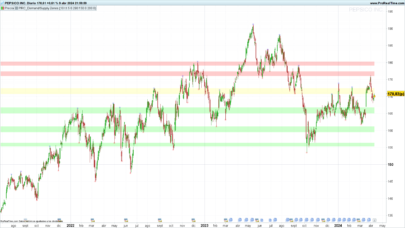
This strict definition filters mere wick pokes. On the chart, active zones are drawn as shaded rectangles with a gradient that intensifies toward the current edge, while broken zones retain a colored left anchor (red for upper, green for lower) and a grey baseline marking the final extent.
4) Efficient rendering
The script uses DEFPARAM DrawOnLastBarOnly = true and updates drawings inside islastbarupdate, which significantly reduces overhead on lower timeframes and keeps scrolling smooth.
Reading the chart
Think of each zone as a memory of absorption:
- Upper (red) active zone: sellers previously overwhelmed buyers in that price band. The first retest often meets renewed supply; if price clears above and marks the zone as broken, that prior supply has been consumed and continuation is common.
- Lower (green) active zone: buyers previously absorbed supply. First retests may bounce; a full clear below signals that demand failed and momentum can shift lower.
Broken zones aren’t useless—on the contrary, they often become context for follow‑through. A market that conclusively clears a known obstacle tends to explore the next area of interest.
Practical playbooks (illustrative, not financial advice)
1) First‑retest fade
After a zone forms, wait for the first return into it. Enter with the zone, manage risk just beyond the opposite boundary of the box, and aim for a conservative target (e.g., prior swing or midpoint of the move that birthed the zone). Works best when the original wick scored near 100 and RSI still aligns with the bias.
2) Break‑and‑go
If price fully clears an active zone and marks it broken, look for a minor pullback that respects the cleared boundary from the other side. Enter with the break direction; risk goes just inside the old zone.
3) Confluence stacking
Prioritize zones that overlap with session ranges, round numbers, or recent swing structure, plus RSI in agreement. Confluence won’t turn a bad zone into a good one, but it will improve your average outcome.
Tip: On especially volatile instruments, increase
thresholdand/orlookbackto spare yourself from marginal zones.
Parameters and tuning
The defaults are balanced for many liquid markets. Adjust as follows:
| Parameter | Default | What it controls | When to adjust |
|---|---|---|---|
lookback |
200 | Rolling window used to find the max wick for normalization. | Increase for smoother, slower‑changing scores; decrease to adapt quicker after regime shifts. |
threshold |
80 | Minimum wick score (0–100) to qualify. | Raise to see fewer, stronger zones; lower to map more context. |
extendBars |
20 | Minimum spacing (in bars) between zone births. | Raise to reduce clustering on choppy charts. |
maxLevels |
10 | Maximum number of zones kept in memory. | Tune for screen real estate and clarity. |
rsiLen |
14 | RSI period for regime filter. | Shorter is more reactive; longer is steadier. |
upR/G/B |
255/0/0 | RGB color for upper zones. | Style to match your theme. |
dnR/G/B |
0/255/0 | RGB color for lower zones. | Style to match your theme. |
alpha |
30 | Base fill transparency. | Increase for stronger shading on bright backgrounds. |
Full Code ProRealTime
|
1 2 3 4 5 6 7 8 9 10 11 12 13 14 15 16 17 18 19 20 21 22 23 24 25 26 27 28 29 30 31 32 33 34 35 36 37 38 39 40 41 42 43 44 45 46 47 48 49 50 51 52 53 54 55 56 57 58 59 60 61 62 63 64 65 66 67 68 69 70 71 72 73 74 75 76 77 78 79 80 81 82 83 84 85 86 87 88 89 90 91 92 93 94 95 96 97 98 99 100 101 102 103 104 105 106 107 108 109 110 111 112 113 114 115 116 117 118 119 120 121 122 123 124 125 126 127 128 129 130 131 132 133 134 135 136 137 138 139 140 141 142 143 144 145 146 147 148 149 150 151 152 153 154 155 156 157 158 159 160 161 162 163 164 165 166 167 168 169 170 171 172 173 174 175 176 177 178 179 180 181 182 183 184 185 186 |
//--------------------------------------------------- //PRC_Wick Pressure Zones by BigBeluga //version = 0 //09.09.2025 //Iván González @ www.prorealcode.com //Sharing ProRealTime knowledge //--------------------------------------------------- DEFPARAM DrawOnLastBarOnly = true //--------------------------------------------------- // inputs //--------------------------------------------------- lookback = 200 threshold = 80 extendBars = 20 maxLevels = 10 rsiLen = 14 upR = 255 upG = 0 upB = 0 dnR = 0 dnG = 255 dnB = 0 //--------------------------------------------------- // Variables auxiliares //--------------------------------------------------- bodyTop = MAX(open, close) bodyBot = MIN(open, close) // Mechas relativas (evitar división por 0) denUp = MAX(bodyTop, 0.0000001) denLo = MAX(low, 0.0000001) upperWick = (high - bodyTop) / denUp lowerWick = (bodyBot - low) / denLo maxUpper = HIGHEST[lookback](upperWick) maxLower = HIGHEST[lookback](lowerWick) sizeUpWick = 0 sizeLoWick = 0 IF maxUpper > 0 THEN sizeUpWick = FLOOR( (upperWick / maxUpper) * 100 ) ENDIF IF maxLower > 0 THEN sizeLoWick = FLOOR( (lowerWick / maxLower) * 100 ) ENDIF //--------------------------------------------------- myrsi = RSI[rsiLen](close) vol = volume //--------------------------------------------------- // Separación mínima entre zonas ONCE startidx = -100000 //--------------------------------------------------- // Boxes //--------------------------------------------------- ONCE n = 0 newUpper = sizeUpWick >= threshold AND NOT (sizeLoWick >= threshold) AND myrsi > 50 AND (BarIndex - startidx > extendBars) newLower = sizeLoWick >= threshold AND NOT (sizeUpWick >= threshold) AND myrsi < 50 AND (BarIndex - startidx > extendBars) // Crear zona superior IF newUpper THEN startidx = BarIndex n = n + 1 $side[n] = 1 $left[n] = BarIndex - 1 $top[n] = high $bot[n] = bodyTop $right[n] = barindex + 1 $broken[n] = 0 $volume[n] = volume // Límite de zonas: mantener sólo las más recientes IF n > maxLevels THEN // Shift a la izquierda FOR k = 1 TO n - 1 DO $side[k] = $side[k+1] $left[k] = $left[k+1] $top[k] = $top[k+1] $bot[k] = $bot[k+1] $right[k] = $right[k+1] $broken[k] = $broken[k+1] $volume[k] = $volume[k+1] NEXT n = maxLevels ENDIF ENDIF // Crear zona inferior IF newLower THEN startidx = BarIndex n = n + 1 $side[n] = -1 $left[n] = BarIndex - 1 $top[n] = bodyBot $bot[n] = low $right[n] = barindex + 1 $broken[n] = 0 $volume[n] = volume IF n > maxLevels THEN FOR k = 1 TO n - 1 DO $side[k] = $side[k+1] $left[k] = $left[k+1] $top[k] = $top[k+1] $bot[k] = $bot[k+1] $right[k] = $right[k+1] $broken[k] = $broken[k+1] $volume[k] = $volume[k+1] NEXT n = maxLevels ENDIF ENDIF //--------------------------------------------------- // DIBUJO y GESTIÓN //--------------------------------------------------- IF islastbarupdate THEN FOR i = 1 TO n DO for j=barindex-$right[i] downto 0 do IF $side[i] = 1 AND low[j] > $top[i] THEN $broken[i] = 1 $right[i] = barindex[j] break ELSIF $side[i] = -1 AND high[j] < $bot[i] THEN $broken[i] = 1 $right[i] = barindex[j] break ENDIF next vol=$volume[i] if $broken[i]=1 and $side[i]=1 then drawrectangle($left[i],$bot[i],$left[i]+2,$top[i])coloured("red") drawsegment($left[i],$top[i],$right[i],$top[i])coloured("grey",125)style(line,3) ELSIF $broken[i]=0 AND $side[i]=1 THEN leftX = $left[i] rightX = barindex topY = $top[i] botY = $bot[i] height = ABS(topY - botY) IF height > 0 THEN steps = 10 stepH = height / steps DRAWRECTANGLE(leftX, topY, leftX + 2, botY) COLOURED(upR,upG,upB) FOR s = 0 TO steps - 1 DO segBot = botY + stepH * s segTop = segBot + stepH alphaVal = 30 + s * 12 IF s = steps - 1 THEN alphaVal = 160 ENDIF DRAWRECTANGLE(leftX, segTop, rightX, segBot) COLOURED(upR,upG,upB, 0)fillcolor(upR,upG,upB, alphaVal) NEXT midY = botY + height * 0.5 DRAWTEXT("#vol#", rightX, midY) ENDIF elsif $broken[i]=1 and $side[i]=-1 then drawrectangle($left[i],$bot[i],$left[i]+2,$top[i])coloured("green") drawsegment($left[i],$bot[i],$right[i],$bot[i])coloured("grey",125)style(line,3) ELSIF $broken[i]=0 AND $side[i]=-1 THEN leftX = $left[i] rightX = barindex topY = $top[i] botY = $bot[i] height = ABS(topY - botY) IF height > 0 THEN steps = 10 stepH = height / steps DRAWRECTANGLE(leftX, topY, leftX + 2, botY) COLOURED(dnR,dnG,dnB) FOR s = 0 TO steps - 1 DO segBot = botY + stepH * s segTop = segBot + stepH alphaVal = 160 - s * 12 IF s = 0 THEN alphaVal = 160 ENDIF DRAWRECTANGLE(leftX, segTop, rightX, segBot) COLOURED(dnR,dnG,dnB, 0)fillcolor(dnR,dnG,dnB, alphaVal) NEXT midY = botY + height * 0.5 DRAWTEXT("#vol#", rightX, midY) ENDIF endif NEXT ENDIF RETURN |
Share this
No information on this site is investment advice or a solicitation to buy or sell any financial instrument. Past performance is not indicative of future results. Trading may expose you to risk of loss greater than your deposits and is only suitable for experienced investors who have sufficient financial means to bear such risk.
ProRealTime ITF files and other attachments :PRC is also on YouTube, subscribe to our channel for exclusive content and tutorials
