

Wick Pressure
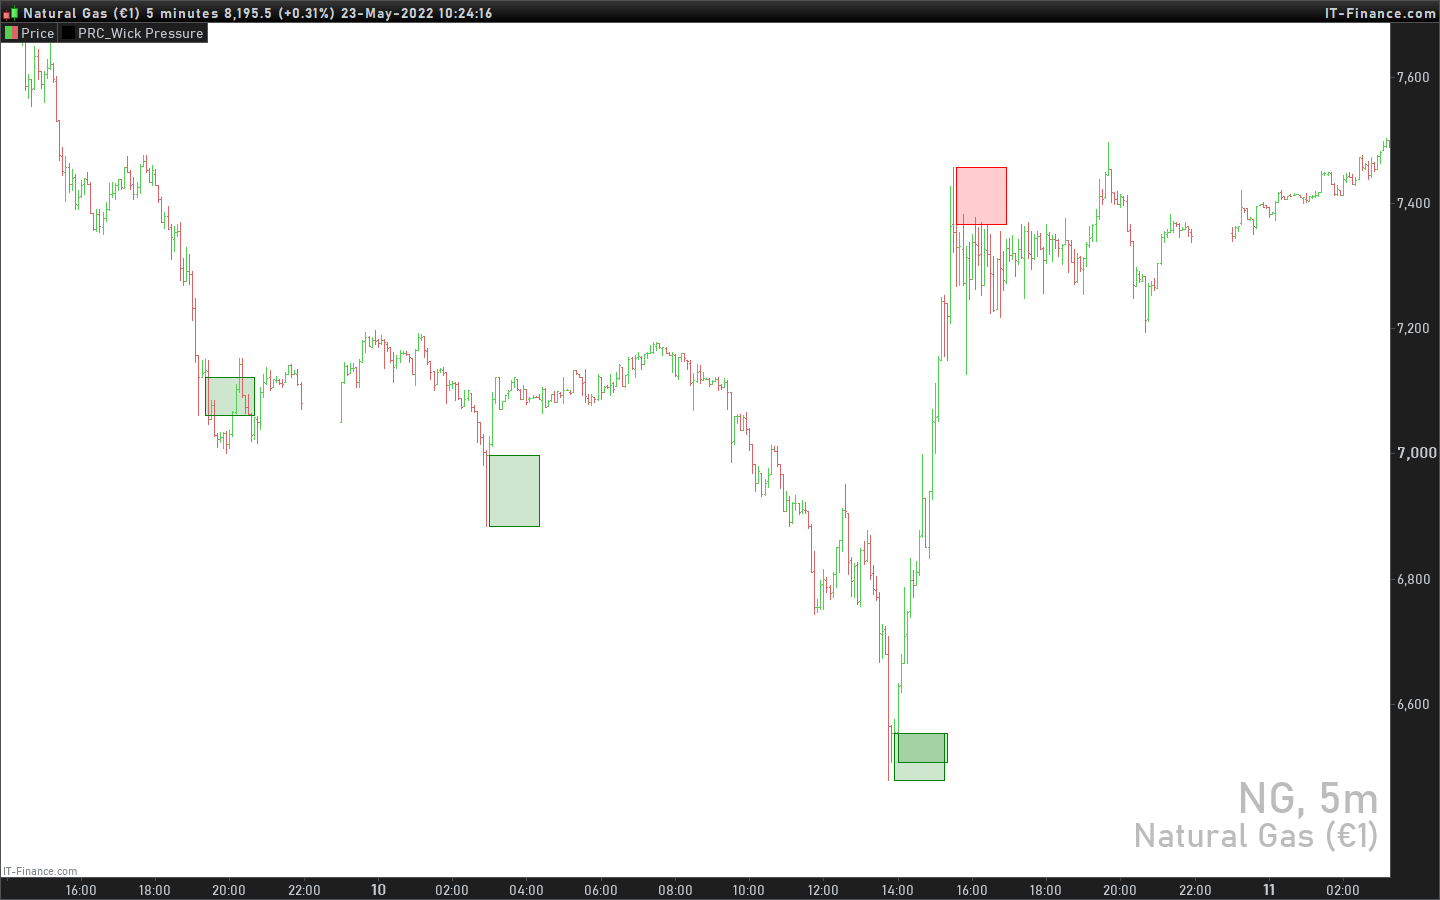
Multiple Wicks forming at OverSold & OverBought levels create Buying and Selling Pressure. This Script tries to capture the essence of the buy and sell pressure created by those wicks. Wick pressure shows that the trend is Exhausted.
How it works:
This Wick Pressure Indicator checks for three candles forming the wicks in overbought and oversold zones. The zones are set by RSI and can be changed in settings. Those three candles should form a bit long wick and length of the wick is determined by ATR. The ATR multiple can be changed from settings. And then the script draws a box in the area formed by three candle wicks.
Confluence:
This indicator should not be used on its own. You should include it in your existing trading strategy. Any indicator should be rigorously tested before making any real trades.
Settings is the Key:
Settings are key to all of my indicators. Play around with it a bit. Change the ATR multiplier. Read the tooltips to understand what each settings mean. Tooltips are the (i) button in-front of each settings.
(description from original author: SiddWolf)
//PRC_Wick Pressure | indicator
//23.05.2022
//Nicolas @ www.prorealcode.com
//Sharing ProRealTime knowledge
//converted from pinescript

// --- settings
atrmult = 0.7 //ATR Multiplier (The Wick area is filtered on the basis of atr and this is multiplier to that ATR. The more the multiplier value, the less the signals and vice versa)
boxlength = 16 //Length of Wick Pressure Box
rsiob = 60 //RSI based on which signnals are filtered
rsios = 40 //RSI based on which signnals are filtered
// --- end of settings

meersi = rsi[14](close)

//bullish wick pressure
rsibullishcond = meersi < rsios or meersi[1] < rsios or meersi[2] < rsios
ll3 = lowest[3](low)
lc3 = min(lowest[3](close),lowest[3](open))
if low<=lc3 and low[1]<=lc3 and low[2]<=lc3 and open>=lc3 and open[1]>=lc3 and open[2]>=lc3 and lc3-ll3>(atrmult*AverageTrueRange[14](close)) and rsibullishcond and close>open then
 drawrectangle(barindex,lc3,barindex+boxlength, ll3) coloured("green",50) bordercolor("green")
endif

//bearish wick pressure
rsibearishcond = meersi > rsiob or meersi[1] > rsiob or meersi[2] > rsiob
hh3 = highest[3](high)
hc3 = max(highest[3](close), highest[3](open))
if high>=hc3 and high[1]>=hc3 and high[2]>=hc3 and open<=hc3 and open[1]<=hc3 and open[2]<=hc3 and hh3-hc3>(atrmult*AverageTrueRange[14](close)) and rsibearishcond and close<open then
 drawrectangle(barindex,hh3,barindex+boxlength, hc3) coloured("red",50) bordercolor("red")
endif

return