

Weis Wave
January 19, 2019, 5:10 PM
Indicators
10 Comments
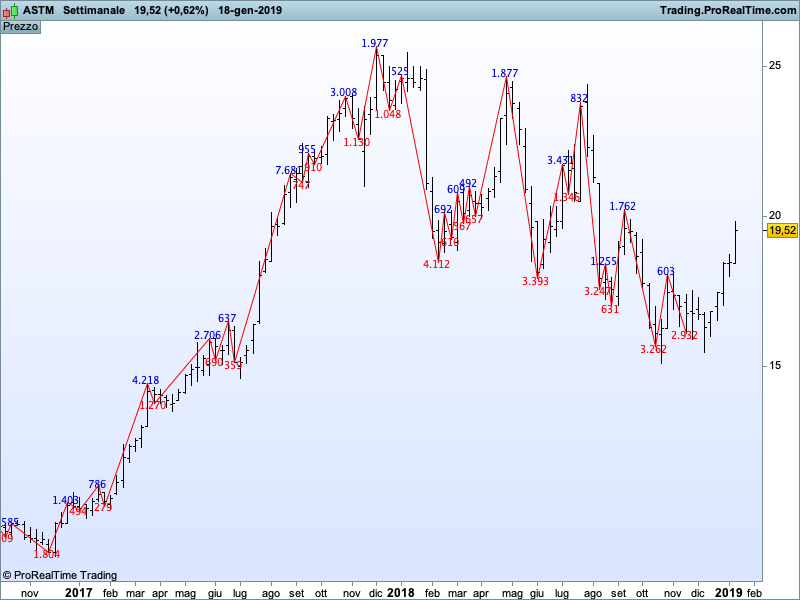
This code draws the Weis wave (or Wyckoff wave) on the price line and print the volume traded on the up or down leg. It comes from the book “trades about to happen”. For whoever likes to use Wyckoff it will be useful.
The code allows you to chose ATR (with Wilder’s average/SMA/EMA/WMA..) or a traditional box. When the box cell is zero the code uses automatically the ATR.
Blue skies!!!
//parameters :
//MM=0
//periodo=14
//box=0 (in case the boxsize has to be based on ATR) or any other value for traditional computation
//coeff=1
if box=0 then
 boxsize = coeff*average[periodo,MM](tr)
else
 boxsize=box
endif

once topprice = close
once bottomprice = close - boxsize
once barold=0
once posold=close

if barindex>2*periodo then
 if (close > topprice) THEN
  valup=round((close-topprice)/boxsize)+1
  topprice=topprice + valup*boxsize
  bottomprice = topprice - boxsize
  up=1
  down=0
 ELSIF (close < bottomprice ) THEN
  valdown=round((bottomprice-close)/boxsize)+1
  bottomprice = bottomprice - valdown*boxsize
  topprice = bottomprice + boxsize
  up=0
  down=1
 ELSE
  topprice = topprice
  bottomprice = bottomprice
 ENDIF

 //calcolo linee zig zag
 //trend up
 if up=1 then
  if up[1]=0 then
   drawsegment(barold,posold,barnew,posnew) coloured (250,0,0)
   drawtext("#downvol#",barnew,posnew*0.995) coloured (250,0,0)
   barold=barnew
   posold=posnew
   upvol=0
   downvol=0
  endif
  if close>posnew then
   posnew=high
   barnew=barindex
  endif
  upvol=upvol+round(volume/1000)
 endif

 //trend down
 if down=1 then
  if down[1]=0 then
   drawsegment(barold,posold,barnew,posnew) coloured (250,0,0)
   drawtext("#upvol#",barnew,posnew*1.005) coloured (0,0,210)
   barold=barnew
   posold=posnew
   upvol=0
   downvol=0
  endif
  if close<posnew then
   posnew=low
   barnew=barindex
  endif
  downvol=downvol+round(volume/1000)
 endif

endif
RETURN
Download
Filename:
Mio-Weis-wave.itf
Downloads:
422
Master
This author is like an anonymous function, present but not directly identifiable. More details on this code architect as soon as they exit 'incognito' mode.
Author’s Profile
Loading...