

Weekly & Daily Pivot Points
April 25, 2016, 2:52 PM
Indicators
4 Comments
Hello everyone,
The calculation of pivot points is very easy, since the formulas are well known.
As I try to backtest strategies using pivot points, I had the idea to create an indicator that combines both the weekly and daily pivot points.
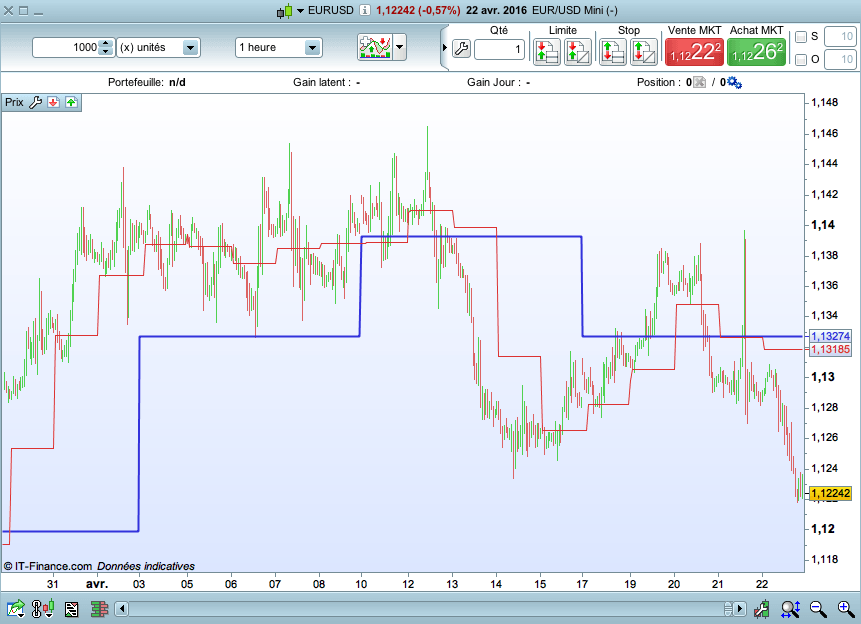
On the chart, you see the weekly pivot point (blue line), and the daily pivot point (red).
From this, many strategies should be possible to create.
Tell me if you have an effective strategy, I can backtest it !
// POINT PIVOT HEBDOMADAIRE
IF dayofweek < dayofweek[1] THEN
weekhigh = prevweekhigh
weeklow = prevweeklow
weekclose = prevweekclose
prevweekhigh = high
prevweeklow = low
ENDIF

prevweekhigh = max(prevweekhigh, high)
prevweeklow = min(prevweeklow, low)
prevweekclose = close

PPWeek = (weekhigh + weeklow + weekclose) / 3


// POINT PIVOT JOURNALIER
IF dayofweek = 1 THEN
dayhigh = DHigh(2)
daylow = DLow(2)
dayclose = DClose(2)
ENDIF

IF dayofweek >=2 and dayofweek < 6 THEN
dayhigh = DHigh(1)
daylow = DLow(1)
dayclose = DClose(1)
ENDIF

PPDay = (dayhigh + daylow + dayclose) / 3


RETURN PPWeek COLOURED(50,50,220) AS"Pivot Week", PPDay COLOURED (220,50,50) as "Point Pivot"
Download
Filename:
POINTS-PIVOT-WEEK-DAY.itf
Downloads:
238
Master
Hello, I'm Marc.
Nice to meet you.
Author’s Profile
Loading...