

VWMA-SMA Map
April 20, 2020, 11:31 AM
Indicators
1 Comment
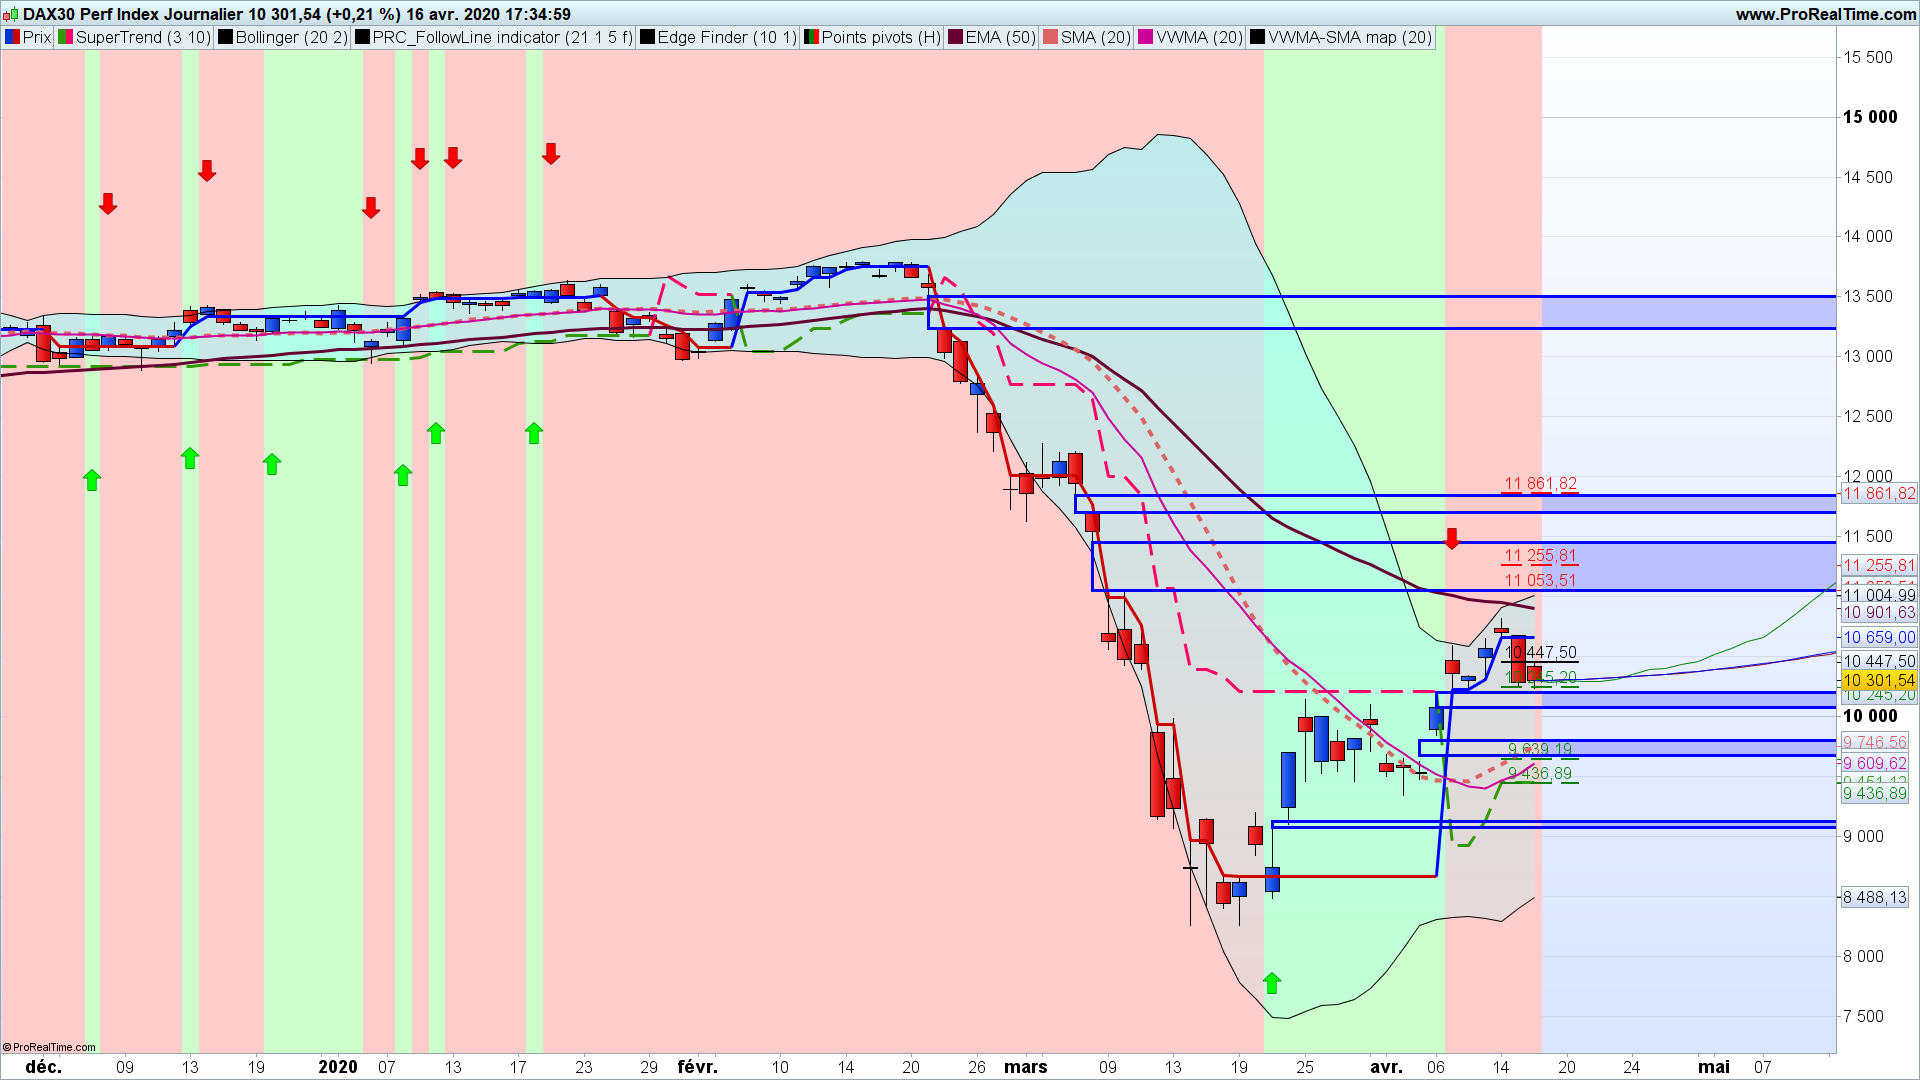
Attached is an interesting indicator since it is directly in the background of the graph with its colors. It is a question of informing at a glance the crossing of two averages the VWMA and the SMA, which makes it possible to inform a weakening of the current trend before seeing it in the courses. ps: the VWMA is already published in the library
// VWMA

tempValue = 0.0
tempVolume = 0.0

for step = 0 to length do

 tempValue = tempValue + (close[step] * volume[step])
 tempVolume = tempVolume + volume[step]

next

vwma = tempValue / tempVolume


sma = average[20](close)

IF vwma > sma  THEN
 backgroundcolor(204,255,204)
else
 backgroundcolor(255,204,204)
endif

IF vwma[1]<sma[1] and vwma>sma THEN
 drawarrowup(barindex,low-(low/12))coloured(0,255,0)
elsif vwma[1]>sma[1] and vwma<sma THEN
 drawarrowdown(barindex,high+(high/12)) coloured (255,0,0)
endif

RETURN
Download
Filename:
VWMA-SMA-map.itf
Downloads:
198

Master
I usually let my code do the talking, which explains why my bio is as empty as a newly created file. Bio to be initialized...
Author’s Profile
Loading...