

VWAP@Time
August 20, 2020, 10:12 AM
Indicators
2 Comments
Another version of the VWAP indicator for intraday traders, this time you can set the “startTime” and the “endTime” of its plot with a time in “hhmmss” format (modify it in the indicator settings).
The VWAP formula is:
VWAP = Sum (Price[t] x Volume[t]) / Sum(Volume[t])
// VWAP@Time intraday
// 10.04.2020
// Daniele Maddaluno

if opentime < startTime or opentime > endTime then
 n = 0
 dwapT1 = 0
 dwapT2 = 0

 priced  = 0
 shared  = 0
 summ = 0

 vwap = close
 vwapstd = 0
else
 n = n + 1
 // This if has been added just for plot reasons
 if n <= 1 then
  dwapT1 = 0
  dwapT2 = 0
 else
  dwapT1 = 190
  dwapT2 = 128
 endif

 priced = priced + (totalprice*volume)
 shared = shared + volume

 if shared>0 then
  vwap = priced/shared

  summ = summ + square(totalprice - vwap)
  vwapstd = sqrt(summ / n)
 endif

endif


// Manage the coloring of vwap mid line
if close > vwap then
 dwapR = 0
 dwapG = 128
 dwapB = 192
else
 dwapR = 255
 dwapG = 0
 dwapB = 0
endif

vwapstd1 = vwapstd*NumDevs1
vwapstd2 = vwapstd*NumDevs2
vwapstd3 = vwapstd*NumDevs3

return vwap coloured(dwapR, dwapG, dwapB, dwapT1) as "vwap", vwap + vwapstd1 coloured(128, 128, 0, dwapT2) as "upVwap1", vwap - vwapstd1 coloured(128, 128, 0, dwapT2) as "dwVwap1", vwap + vwapstd2 coloured(128, 128, 0, dwapT2) as "upVwap2", vwap - vwapstd2 coloured(128, 128, 0, dwapT2) as "dwVwap2", vwap + vwapstd3 coloured(128, 128, 0, dwapT2) as "upVwap3", vwap - vwapstd3 coloured(128, 128, 0, dwapT2) as "dwVwap3"
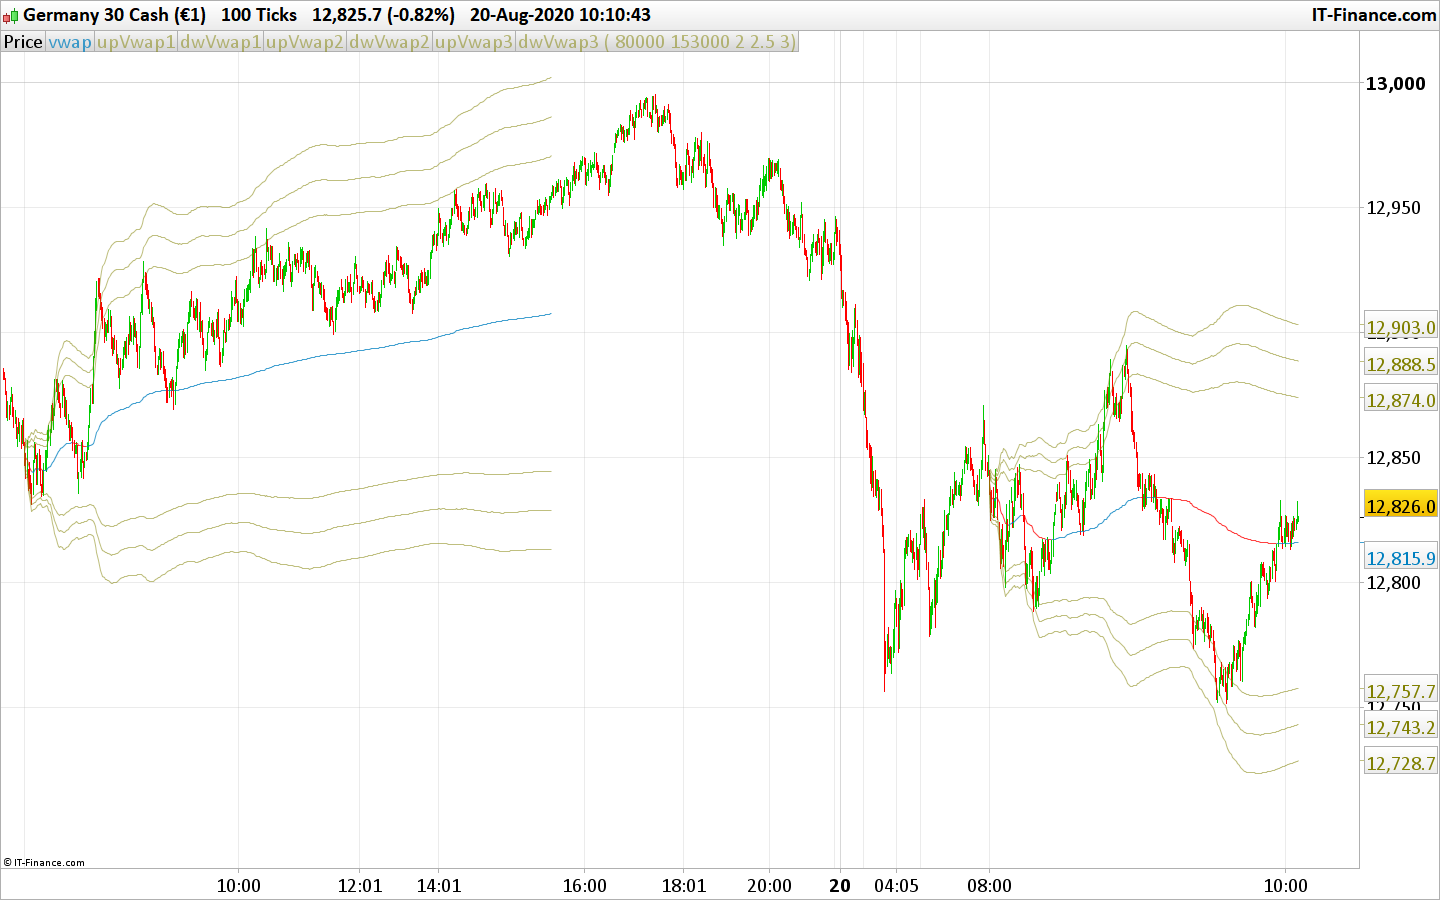
For example in the image above I have set two VWAP@Time on the DAX 100ticks:
– the first has startTime=80000, endTime=153000 (and 2, 2,5, 3 as devs)
– the latter has startTime=153000, endTime=220000 (and 2, 2,5, 3 as devs)
Download
Filename:
VWAP@Time.itf
Downloads:
311
Master
As an architect of digital worlds, my own description remains a mystery. Think of me as an undeclared variable, existing somewhere in the code.
Author’s Profile
Loading...