

VWAP Date anchored
October 19, 2017, 9:23 AM
Indicators
26 Comments
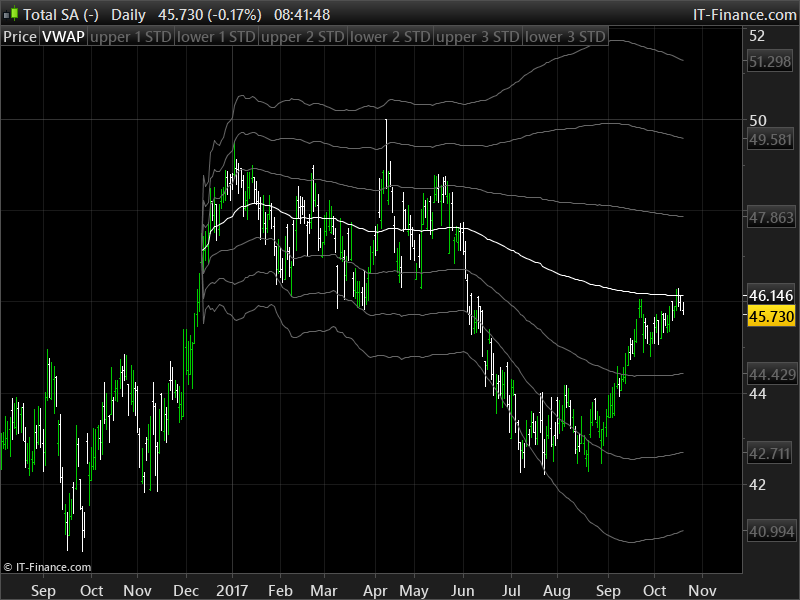
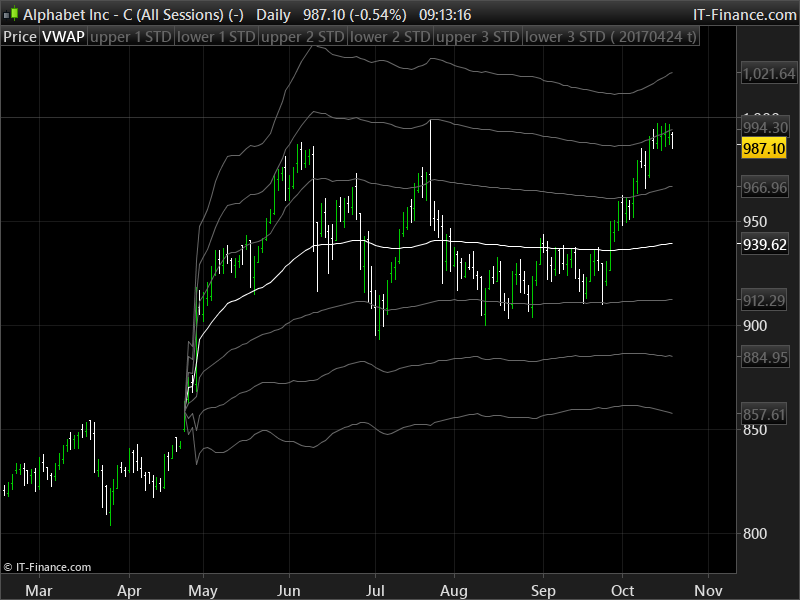
Another version of the VWAP indicator, this time you can set the start of its calculation with a date in YYYYMMDD format (modify it in the indicator settings). Set it on the last gap a stock on a daily timeframe will give you a good idea of the mean price since this particular day.
You also have the possibility to view or not the 3 upper and 3 lower standard deviation lines with a switch in the settings.
The VWAP formula is:
VWAP = Sum (Price[t] x Volume[t]) / Sum(Volume[t])
Indicator coded by a request made in this forum topic: https://www.prorealcode.com/topic/anchored-vwap/
//PRC_VWAP Date anchored | indicator
//19.10.2017
//Nicolas @ www.prorealcode.com
//Sharing ProRealTime knowledge

// --- settings
//startDate = 20161212
//viewSD = 1 //1 = true / 0 = false
// --- end of settings

VWAP=undefined
SDup1 = undefined
SDlw1 = undefined
SDup2 = undefined
SDlw2 = undefined
SDup3 = undefined
SDlw3 = undefined

if opendate=startDate then
 startbar=barindex
endif
if opendate>=startDate then
 barcount=barindex-startbar

 d = max(1, barcount)

 VWAP = SUMMATION[d](volume*typicalprice)/SUMMATION[d](volume)
 if(barcount=0) then
  sd = 0
 else
  sd = SUMMATION[d](max(abs(high-vwap),abs(vwap-low)))/d
 endif

 if viewSD then
  SDup1 = vwap+sd
  SDlw1 = vwap-sd
  SDup2 = vwap+sd*2
  SDlw2 = vwap-sd*2
  SDup3 = vwap+sd*3
  SDlw3 = vwap-sd*3
 endif

 if vwap>vwap[1] then
  color = 1
 else
  color = -1
 endif
endif

RETURN VWAP coloured by color as "VWAP", SDup1 coloured(102,102,102) as "upper 1 STD", SDlw1 coloured(102,102,102) as "lower 1 STD", SDup2 coloured(102,102,102) as "upper 2 STD", SDlw2 coloured(102,102,102) as "lower 2 STD", SDup3 coloured(102,102,102) as "upper 3 STD", SDlw3 coloured(102,102,102) as "lower 3 STD"
Download
Filename:
vwap-anchored-GOOG-example.png
Downloads:
163
Download
Filename:
PRC_VWAP-Date-anchored.itf
Downloads:
699
Master
I created ProRealCode because I believe in the power of shared knowledge. I spend my time coding new tools and helping members solve complex problems.
If you are stuck on a code or need a fresh perspective on a strategy, I am always willing to help. Welcome to the community!
Author’s Profile
Loading...