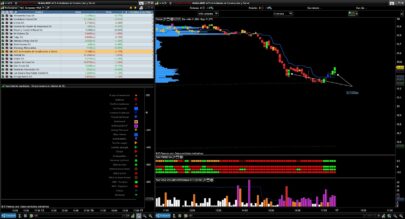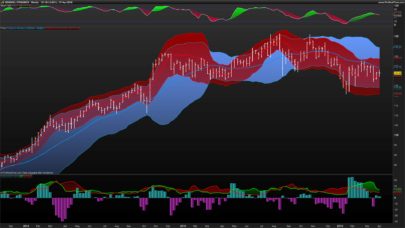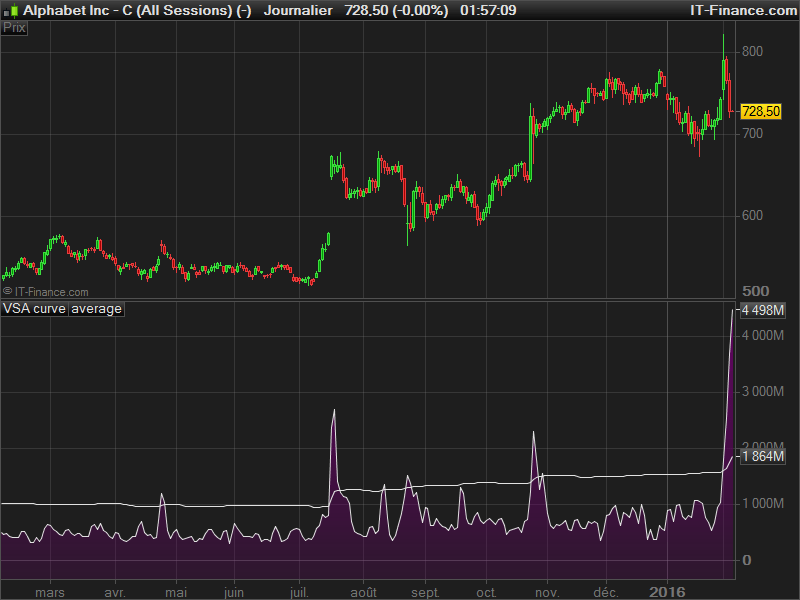
This indicator draw the difference between the high and low of the price related to the volume. Then we make an average of this oscillator over x period (200 periods by default) plus its standard deviation factorized (factor = 1.5 by default). This line act as a signal for abnormal volume exchange over the specified instrument.
This formula is a derivate from the volume spread analysis candles formations.
|
1 2 3 4 5 6 7 8 9 10 11 12 13 |
//parameters // daysperiod = 200 // devFactor = 1.5 VOPEN = VCLOSE[1] VCLOSE = close*volume VHIGH = max(max(high*volume,VCLOSE),VOPEN) VLOW = min(min(low*volume,VOPEN),VCLOSE) VHL2 = (VHIGH+VLOW)/2 MVHL2 = average[daysperiod](VHIGH)+STD[daysperiod](VHIGH)*devFactor RETURN VHL2, MVHL2 as "dev curve signal line" |
Share this
No information on this site is investment advice or a solicitation to buy or sell any financial instrument. Past performance is not indicative of future results. Trading may expose you to risk of loss greater than your deposits and is only suitable for experienced investors who have sufficient financial means to bear such risk.
ProRealTime ITF files and other attachments :
Find other exclusive trading pro-tools on ![]()
PRC is also on YouTube, subscribe to our channel for exclusive content and tutorials