

Voluminator
February 27, 2017, 10:13 AM
Indicators
0 Comments
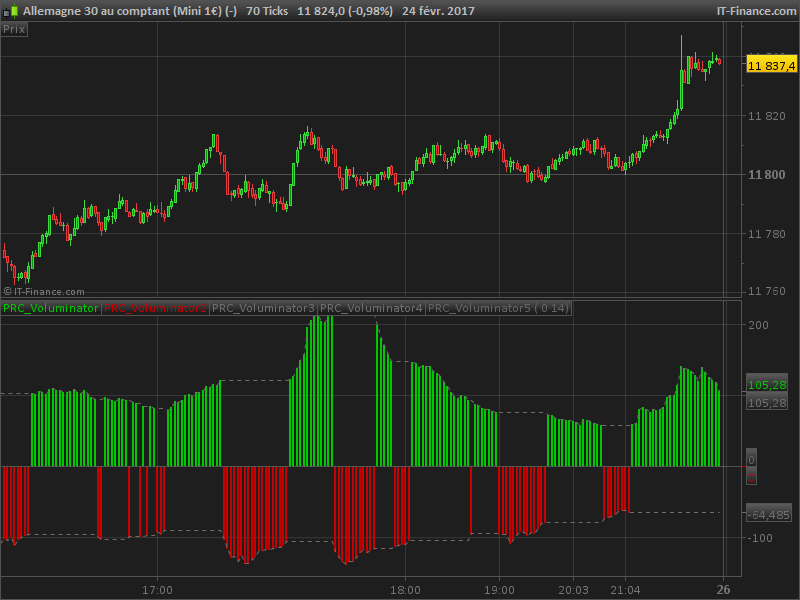
This is an indicator that gives signals of current trend with red/green histogram. Basically, it tests if the actual Close is above or below a moving average (periods and type can be modified in settings).
In a bullish or a bearish trend, the green and red histogram give strength of Volumes information, to identify trend exhaustion or pullbacks.
Converted from an MT4 indicator code, requested on Spanish forum.
//PRC_Voluminator | indicator
//27.02.2017
//Nicolas @ www.prorealcode.com
//Sharing ProRealTime knowledge
//translated from MT4

// --- parameters
//SmoothPeriod = 14
//SmoothMethod =  0 (MMtype)
// ---

once alpha = 2.0/(1.0+SmoothPeriod)

if barindex>SmoothPeriod then
 ma = average[SmoothPeriod,SmoothMethod](close)
 if close>ma then
  vol = +volume
 elsif close<ma then
  vol = -volume
 else
  vol = 0
 endif
 if vol >0 then
  levelu = levelu[1]+alpha*(vol-levelu[1])
 elsif vol <0 then
  levelu = levelu[1]
 else
  levelu = 0
 endif
 if vol <0 then
  leveld = leveld[1]+alpha*(vol-leveld[1])
 elsif vol >0 then
  leveld = leveld[1]
 else
  leveld = 0
 endif

 if vol>0 then
  trend = 1
 elsif vol<0 then
  trend = -1
 else
  trend = 0
 endif

 if trend = 1 then
  valuehu = levelu
  valuehd = 0
 else
  valuehu = 0
  valuehd = leveld
 endif
endif

return valuehu coloured(0,200,0) style(histogram), valuehd coloured(200,0,0) style(histogram), levelu coloured(110,110,110) style(dottedline), leveld coloured(110,110,110) style(dottedline), 0 coloured(100,100,100) style(point)
Download
Filename:
PRC_Voluminator.itf
Downloads:
299
Master
I created ProRealCode because I believe in the power of shared knowledge. I spend my time coding new tools and helping members solve complex problems.
If you are stuck on a code or need a fresh perspective on a strategy, I am always willing to help. Welcome to the community!
Author’s Profile
Loading...