

Volume-Weighted Price Z-Score
1. The problem: is price actually at an extreme?
When a price makes a large move, traders typically ask the same question: is it overextended, or can it continue? Classic oscillators like RSI give a partial answer — one based solely on price movement — but they ignore a critical dimension: volume.
Volume is context. A price move backed by heavy volume carries a completely different meaning than the same move on thin participation. The Volume-Weighted Price Z-Score combines both dimensions: it measures how many standard deviations the current price sits away from its Volume-Weighted Moving Average (VWMA), expressing the result as a normalised statistical score.
The output is a zero-centred oscillator with statistically meaningful boundaries at ±1 and ±2.5. It does not say “RSI is at 70”. It says “price is 2.8 standard deviations above where volume considers fair value”. That distinction matters.
2. How the indicator is calculated
The indicator is built in four sequential steps.
Step 1 — Volume-Weighted Moving Average (VWMA)
The VWMA is computed as the volume-weighted reference price:
volSum = summation[lookback](volume)
IF volSum > 0 THEN
vwmaVal = summation[lookback](CustomClose * volume) / volSum
ELSE
vwmaVal = CustomClose
ENDIF
Price multiplied by volume is accumulated over the lookback window, then divided by total volume. The result is the true market-weighted average price — not a simple arithmetic mean of closes. If no volume is available, the current price is used as a fallback.
Step 2 — Logarithmic deviation
Instead of a simple arithmetic difference (price − VWMA), the log of their ratio is used:
IF vwmaVal > 0 THEN
logDev = log(CustomClose / vwmaVal)
ELSE
logDev = 0
ENDIF
Logarithmic deviation is symmetric: a +100% move and a −50% move carry equal absolute weight. It is also time-additive, making it suitable for cross-asset and cross-timeframe comparisons.
Step 3 — Statistical normalisation (Z-Score)
The log deviation is divided by its own historical volatility to produce the raw Z-Score:
volMeasure = std[lookback](logDev)
IF volMeasure > 0 THEN
rawZ = logDev / volMeasure
ELSE
rawZ = 0
ENDIF
This step is the core of the indicator. Dividing by the standard deviation produces a dimensionless, statistically interpretable value: a reading of +2 means price is 2 standard deviations above its volume-weighted fair value — a condition that, under a normal distribution, occurs less than 5% of the time.
Step 4 — Final smoothing
A simple moving average is applied to reduce short-term noise:
zScore = average[smoothing,1](rawZ)
The second parameter (1) specifies a simple moving average. Higher smoothing values produce a cleaner line but introduce more lag.
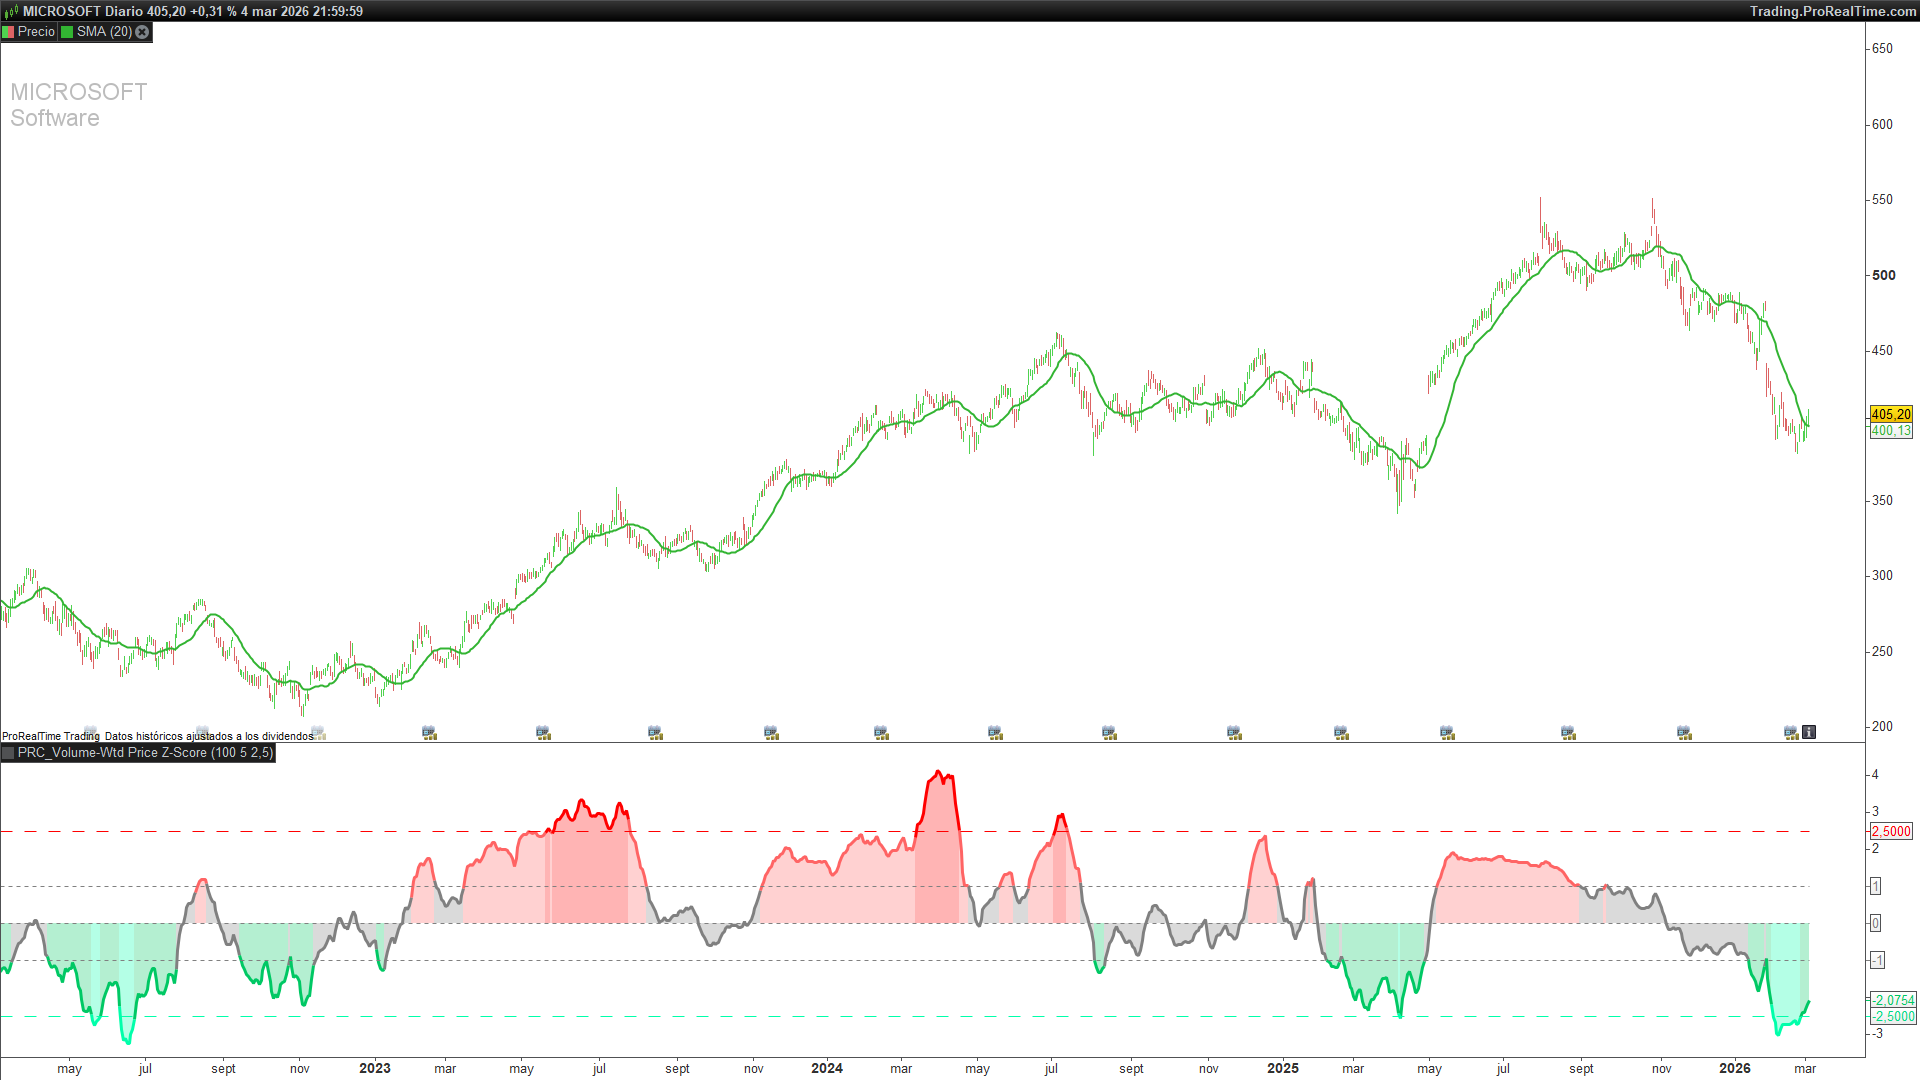
3. Reading the indicator
The Z-Score oscillates around zero. The key reference levels are ±1 (one standard deviation) and ±2.5 (the extreme threshold). Five colour zones make interpretation immediate:
• Bright red (Z ≥ +2.5): Extreme overbought. Price is statistically far above its volume-weighted mean. Less than 1.2% of observations in a normal distribution.
• Soft red (+1 to +2.5): Elevated bullish zone. Market is stretched. Use caution when looking for long entries.
• Grey (−1 to +1): Neutral zone. Price is close to volume-weighted fair value. No statistical edge in either direction.
• Soft green (−2.5 to −1): Moderate bearish zone. Potential area of interest for long setups with additional confirmation.
• Bright green (Z ≤ −2.5): Extreme oversold. Price is statistically far below its volume-weighted mean. Potential reversal candidate.
A few practical notes on reading the indicator:
• The indicator provides context, not standalone buy/sell signals. Always combine with price action or other confirmation tools.
• Zero-line crossovers are meaningful: a move from negative to positive territory with rising volume can signal a bias shift.
• Extreme readings (≥ ±2.5) are the most actionable, especially when accompanied by volume divergence or price divergence.
• In strong trending markets, the Z-Score can remain elevated for many bars. This is not a malfunction — it means the trend is consistently backed by volume.
4. Parameters and presets
The indicator has three configurable parameters:
• lookback (default: 100): Calculation window for the VWMA, log deviation, and volatility measurement. Larger values produce smoother output and fewer false signals, at the cost of added lag.
• smoothing (default: 5): Periods of the final simple moving average applied to the raw Z-Score. Reduces short-term noise.
• extremeThresh (default: 2.5): Statistical threshold defining overbought/oversold extremes. Typical range: 2.0 (more signals) to 3.0 (only genuine extremes). For highly volatile assets such as crypto or small caps, consider raising it to 3.0. For low-volatility instruments such as bond ETFs, 2.0 may capture meaningful extremes more frequently.
Three presets are included in the code. Uncomment the relevant block before applying the indicator:
• Default (lookback=100, smoothing=5): Swing trading on daily and 4H charts.
• Fast Response (lookback=50, smoothing=3): Intraday trading and scalping on 15-min charts or below.
• Smooth Trend (lookback=200, smoothing=8): Position trading on weekly charts.
5. Full ProRealTime code
The code below is ready to paste into the ProBuilder editor.
//--------------------------------------------
// PRC_Volume-Weighted Price Z-Score(by QuantAlgo)
// version = 0
// 05.03.2026
// Iván González @ www.prorealcode.com
// Sharing ProRealTime knowledge
//--------------------------------------------
//=== PRESET CONFIGURATION ===
//--------------------------------------------
lookback = 100
smoothing = 5
//=== THRESHOLD ===
extremeThresh = 2.5
//--------------------------------------------
//=== VWMA CALCULATION ===
//--------------------------------------------
volSum = summation[lookback](volume)
IF volSum > 0 THEN
vwmaVal = summation[lookback](CustomClose * volume) / volSum
ELSE
vwmaVal = CustomClose
ENDIF
//--------------------------------------------
//=== Z-SCORE ===
//--------------------------------------------
IF vwmaVal > 0 THEN
logDev = log(CustomClose / vwmaVal)
ELSE
logDev = 0
ENDIF


volMeasure = std[lookback](logDev)


IF volMeasure > 0 THEN
rawZ = logDev / volMeasure
ELSE
rawZ = 0
ENDIF


zScore = average[smoothing,1](rawZ)
//--------------------------------------------
//=== DISCRETE COLOR RANGES (5 tramos) ===
//--------------------------------------------
IF zScore >= extremeThresh THEN
cr = 255
cg = 0
cb = 0
ELSIF zScore >= 1 THEN
cr = 255
cg = 100
cb = 100
ELSIF zScore > -1 THEN
cr = 128
cg = 128
cb = 128
ELSIF zScore > -extremeThresh THEN
cr = 0
cg = 200
cb = 100
ELSE
cr = 0
cg = 255
cb = 170
ENDIF
//--------------------------------------------
//=== FILL BETWEEN Z-SCORE AND ZERO ===
//--------------------------------------------
zeroLine = 0
colorbetween(zScore, zeroLine, cr, cg, cb, 75)
//--------------------------------------------
//=== REFERENCE LEVELS ===
//--------------------------------------------
posThresh = extremeThresh
negThresh = -extremeThresh
sigmaP1 = 1
sigmaN1 = -1
//--------------------------------------------
RETURN zScore coloured(cr, cg, cb) style(line, 3) AS "Z-Score", zeroLine coloured(128,128,128) style(dottedline) AS "Zero", posThresh coloured(255,0,0) style(dottedline2) AS "+Extreme", negThresh coloured(0,255,170) style(dottedline2) AS "-Extreme", sigmaP1 coloured(128,128,128) style(dottedline) AS "+1s", sigmaN1 coloured(128,128,128) style(dottedline) AS "-1s"
