

Volume Profile fixed range
Standard volume bars tell you how much was traded — but not where. Volume Profile solves that by distributing volume across the price axis, showing you which levels attracted the most activity. This is the Fixed Range version: it analyses a configurable number of bars back and builds the profile over that specific window.
Key Concepts
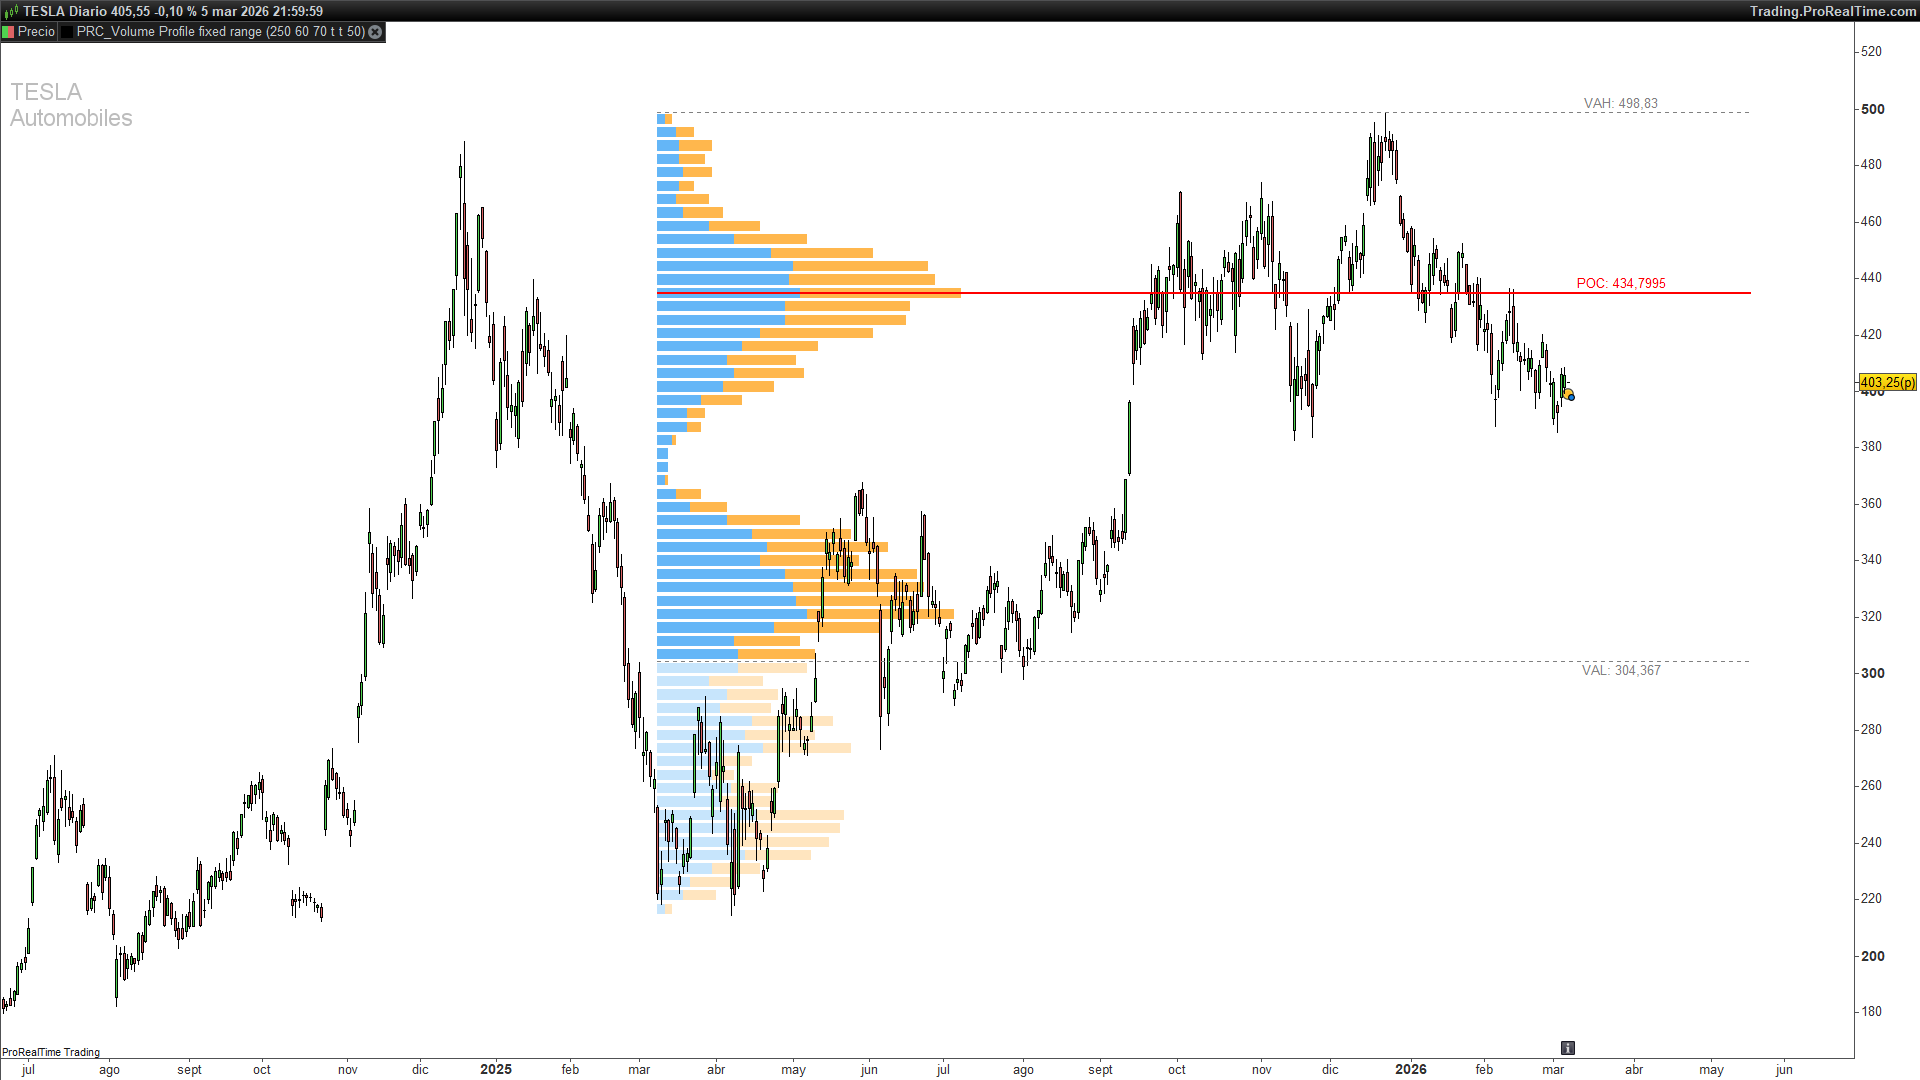
POC — Point of Control The price level with the highest total volume within the range. Drawn as a solid red line. Think of it as the price where buyers and sellers reached the greatest consensus during the analysed period.
Value Area The zone containing a configurable percentage of total volume (default 70%). Calculated by expanding outward from the POC — adding the highest-volume channels above and below — until the threshold is reached.
VAH and VAL — Value Area High / Value Area Low The upper and lower boundaries of the Value Area. Drawn as dotted grey lines. Price inside the VA is considered “accepted value”; outside it, the market is trading at a relative extreme and often reverts.
Volume in each channel is split into bullish volume (bars where close > open, shown in blue) and bearish volume (shown in orange), at both full and reduced opacity depending on whether the channel is inside or outside the Value Area.
How the Calculation Works
Step 1 — Price range and channels The indicator finds the highest high and lowest low over the last bbars candles and divides that range into cnum equal-height channels.
Step 2 — Volume distribution For each candle in the window, volume is not assigned uniformly. The algorithm splits each bar into three parts: body, upper wick, and lower wick. Each part receives a proportional share of the bar’s total volume, then that share is distributed across whichever price channels the part overlaps.
Bullish/bearish assignment: the body of a bullish bar adds to buy-side volume; the body of a bearish bar adds to sell-side. Wicks are split 50/50 between both sides regardless of bar direction, since their directional intent cannot be determined.
Step 3 — POC detection After accumulating volume per channel, the indicator finds the channel with the highest combined (bullish + bearish) volume. That is the POC.
Step 4 — Value Area expansion Starting from the POC, the algorithm compares the next channel above against the next channel below, adds whichever has more volume, and repeats until the accumulated volume reaches pctVA% of the total.
Step 5 — Scaling and drawing Volumes are scaled so the highest-volume channel fills a width proportional to bbars / 3. Each channel is drawn as a filled rectangle using drawrectangle(), with stronger opacity inside the Value Area and reduced opacity outside.
How to Read It
- Bright blue bars — bullish volume inside the Value Area.
- Bright orange bars — bearish volume inside the Value Area.
- Faint blue bars — bullish volume outside the Value Area.
- Faint orange bars — bearish volume outside the Value Area.
- Solid red line (POC) — highest-volume level; frequently acts as a price magnet.
- Dotted grey lines (VAH / VAL) — Value Area boundaries. A break of VAH with strong volume often signals continuation; without volume, it may signal a return into the VA.
Parameters
bbars(default 150) — number of bars to analyse.cnum(default 24) — number of price channels.pctVA(default 70) — percentage of total volume that defines the Value Area.showPOC(default 1) — show the POC price label (1 = yes, 0 = no).showVAHL(default 1) — show VAH/VAL price labels (1 = yes, 0 = no).pocExtend(default 50) — how many bars to extend the POC/VAH/VAL lines to the right.
Full code
// ----------------------------------------------
// PRC_Volume Profile / Fixed Range (by LonesomeTheBlue)
// version = 0
// 30.09.2024
// Iván González @ www.prorealcode.com
// Sharing ProRealTime knowledge
// ----------------------------------------------
defparam drawonlastbaronly = true
// ----------------------------------------------
// === PARAMETERS ===
// ----------------------------------------------
bbars = 150       // Number of bars to analyze
cnum = 24         // Number of rows (channels)
pctVA = 70        // Value Area Volume %
showPOC = 1       // Show POC label (1=yes, 0=no)
showVAHL = 1      // Show VAH/VAL labels (1=yes, 0=no)
pocExtend = 50    // POC/VAH/VAL line extension in bars
// ----------------------------------------------
// === COLOR SETTINGS (RGB + Alpha) ===
// ----------------------------------------------
// POC line (red)
pocR = 255
pocG = 0
pocB = 0


// VAH/VAL lines (grey)
vaLineR = 128
vaLineG = 128
vaLineB = 128


// Value Area Up volume (blue, 70% opaque)
vaUpR = 33
vaUpG = 150
vaUpB = 243
vaUpA = 178


// Value Area Down volume (orange, 70% opaque)
vaDnR = 255
vaDnG = 152
vaDnB = 0
vaDnA = 178


// Up Volume outside VA (blue, 25% opaque)
upVolR = 33
upVolG = 150
upVolB = 243
upVolA = 64


// Down Volume outside VA (orange, 25% opaque)
dnVolR = 255
dnVolG = 152
dnVolB = 0
dnVolA = 64
// ----------------------------------------------
// === ATR for label offset ===
// ----------------------------------------------
atr = averagetruerange[14]


// ----------------------------------------------
// MAIN CALCULATION (only on last bar)
// ----------------------------------------------
if barindex >= bbars and islastbarupdate then


topPrice = highest[bbars](high)
botPrice = lowest[bbars](low)
gap = (topPrice - botPrice) / 500
stepSize = (topPrice - botPrice) / cnum


// --- Store channel levels ---
for x = 0 to cnum do
$levels[x] = botPrice + stepSize * x
next


// --- Initialize volume arrays ---
// $vol[0..cnum-1] = up (green) volume
// $vol[cnum..2*cnum-1] = down (red) volume
for x = 0 to cnum * 2 - 1 do
$vol[x] = 0
next


// --- Distribute volume across channels ---
for b = 0 to bbars - 1 do
bTop = max(close[b], open[b])
bBot = min(close[b], open[b])


if close[b] >= open[b] then
isGreen = 1
else
isGreen = 0
endif


tw = high[b] - bTop
bw = bBot - low[b]
bd = bTop - bBot
denom = 2 * tw + 2 * bw + bd


if denom > 0 then
bdVol = bd * volume[b] / denom
twVol = 2 * tw * volume[b] / denom
bwVol = 2 * bw * volume[b] / denom
else
bdVol = 0
twVol = 0
bwVol = 0
endif


for x = 0 to cnum - 1 do
lLo = $levels[x]
lHi = $levels[x + 1]


// Body overlap
if bd > 0 then
bdOvlp = max(0, min(lHi, bTop) - max(lLo, bBot))
bdC = bdOvlp * bdVol / bd
else
bdC = 0
endif


// Top wick overlap
if tw > 0 then
twOvlp = max(0, min(lHi, high[b]) - max(lLo, bTop))
twC = twOvlp * twVol / tw
else
twC = 0
endif


// Bottom wick overlap
if bw > 0 then
bwOvlp = max(0, min(lHi, bBot) - max(lLo, low[b]))
bwC = bwOvlp * bwVol / bw
else
bwC = 0
endif


// Accumulate up volume (green body + half wicks)
if isGreen = 1 then
$vol[x] = $vol[x] + bdC + twC / 2 + bwC / 2
else
$vol[x] = $vol[x] + twC / 2 + bwC / 2
endif


// Accumulate down volume (red body + half wicks)
if isGreen = 1 then
$vol[x + cnum] = $vol[x + cnum] + twC / 2 + bwC / 2
else
$vol[x + cnum] = $vol[x + cnum] + bdC + twC / 2 + bwC / 2
endif
next
next


// --- Find POC and totals ---
maxVol = 0
pocIdx = 0
totalSum = 0


for x = 0 to cnum - 1 do
$totals[x] = $vol[x] + $vol[x + cnum]
totalSum = totalSum + $totals[x]
if $totals[x] > maxVol then
maxVol = $totals[x]
pocIdx = x
endif
next


// --- Calculate Value Area ---
vaTotal = $totals[pocIdx]
vaThreshold = totalSum * pctVA / 100
vaUp = pocIdx
vaDown = pocIdx
vaDone = 0


for x = 0 to cnum - 1 do
if vaDone = 0 then
if vaTotal >= vaThreshold then
vaDone = 1
else
if vaUp < cnum - 1 then
upperV = $totals[vaUp + 1]
else
upperV = 0
endif


if vaDown > 0 then
lowerV = $totals[vaDown - 1]
else
lowerV = 0
endif


if upperV = 0 and lowerV = 0 then
vaDone = 1
else
if upperV >= lowerV then
vaTotal = vaTotal + upperV
vaUp = vaUp + 1
else
vaTotal = vaTotal + lowerV
vaDown = vaDown - 1
endif
endif
endif
endif
next


// --- Scale volumes for display width ---
if maxVol > 0 then
for x = 0 to cnum * 2 - 1 do
$vol[x] = $vol[x] * bbars / (3 * maxVol)
next
endif


// --- Draw volume profile rectangles ---
startX = barindex - bbars + 1


for x = 0 to cnum - 1 do
upW = round($vol[x])
dnW = round($vol[x + cnum])
y1 = $levels[x + 1] - gap
y2 = $levels[x] + gap


if x >= vaDown and x <= vaUp then
// Inside Value Area
if upW > 0 then
drawrectangle(startX, y1, startX + upW, y2) coloured(vaUpR, vaUpG, vaUpB, 0) fillcolor(vaUpR, vaUpG, vaUpB, vaUpA)
endif
if dnW > 0 then
drawrectangle(startX + upW, y1, startX + upW + dnW, y2) coloured(vaDnR, vaDnG, vaDnB, 0) fillcolor(vaDnR, vaDnG, vaDnB, vaDnA)
endif
else
// Outside Value Area
if upW > 0 then
drawrectangle(startX, y1, startX + upW, y2) coloured(upVolR, upVolG, upVolB, 0) fillcolor(upVolR, upVolG, upVolB, upVolA)
endif
if dnW > 0 then
drawrectangle(startX + upW, y1, startX + upW + dnW, y2) coloured(dnVolR, dnVolG, dnVolB, 0) fillcolor(dnVolR, dnVolG, dnVolB, dnVolA)
endif
endif
next


// --- Draw POC line + label ---
pocLevel = ($levels[pocIdx] + $levels[pocIdx + 1]) / 2
drawsegment(startX, pocLevel, barindex + pocExtend, pocLevel) coloured(pocR, pocG, pocB) style(line, 2)


if showPOC = 1 then
drawtext("POC: #pocLevel#", barindex + 15, pocLevel + 0.25 * atr) coloured(pocR, pocG, pocB)
endif


// --- Draw VAH line + label ---
vahLevel = $levels[vaUp + 1]
drawsegment(startX, vahLevel, barindex + pocExtend, vahLevel) coloured(vaLineR, vaLineG, vaLineB) style(dottedline, 1)


if showVAHL = 1 then
drawtext("VAH: #vahLevel#", barindex + 15, vahLevel + 0.25 * atr) coloured(vaLineR, vaLineG, vaLineB)
endif


// --- Draw VAL line + label ---
valLevel = $levels[vaDown]
drawsegment(startX, valLevel, barindex + pocExtend, valLevel) coloured(vaLineR, vaLineG, vaLineB) style(dottedline, 1)


if showVAHL = 1 then
drawtext("VAL: #valLevel#", barindex + 15, valLevel - 0.25 * atr) coloured(vaLineR, vaLineG, vaLineB)
endif


endif
// ----------------------------------------------
RETURN
