

Volume Order Blocks (VOB)
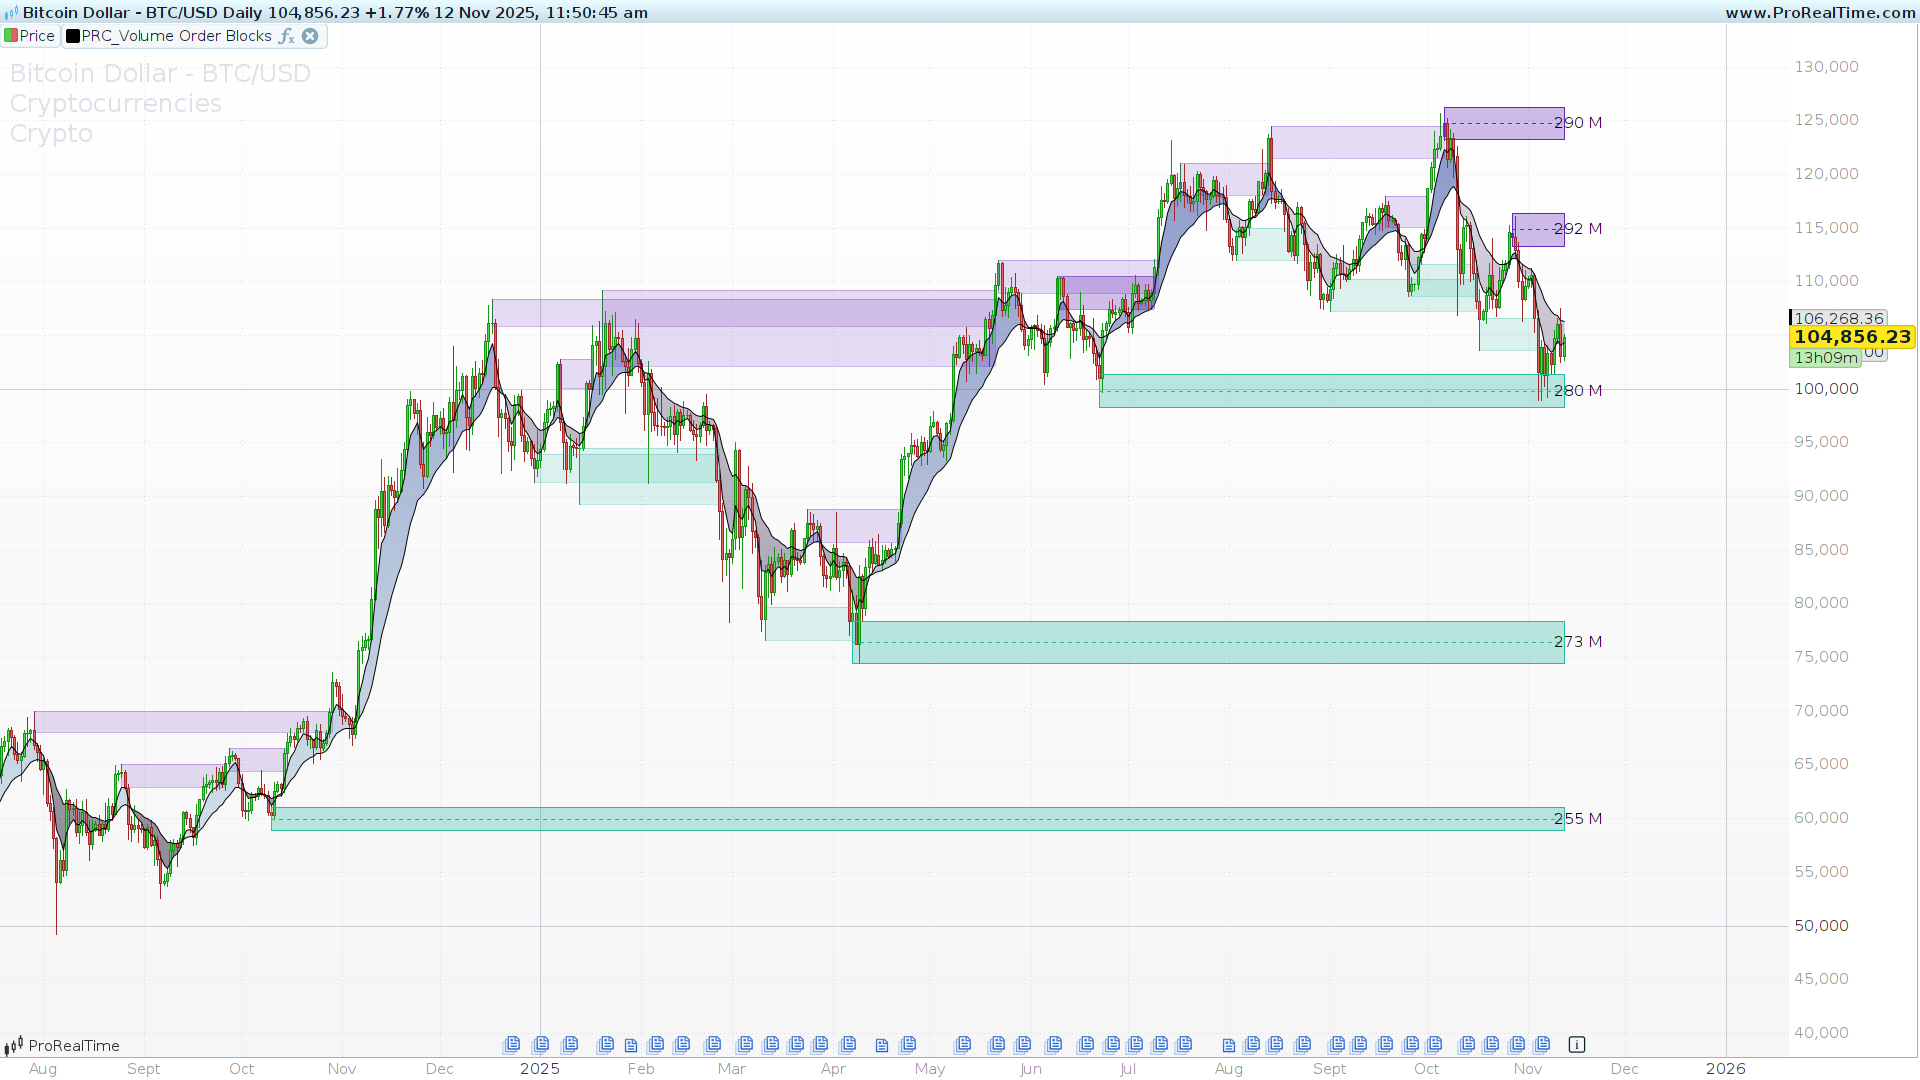
Today, we are thrilled to feature a powerful and sophisticated indicator developed by BigBeluga: the Volume Order Blocks (VOB).
This indicator is designed to automatically identify and plot high-probability “Order Blocks” directly on your ProRealtime charts. These blocks represent significant zones of supply and demand, which often act as strong dynamic support or resistance levels.
How the Indicator Works (The Logic)
At its core, the VOB indicator identifies potential trend reversals and the price zones that trigger them. It combines trend analysis with price extremes to define these blocks.
1. The Trend Trigger (EMA Cross)
The indicator first establishes the medium-term trend using two Exponential Moving Averages (EMAs), a fast one and a slow one. A crossover of these EMAs signals a potential shift in the market direction and serves as the trigger for the indicator to start looking for a new order block.
2. Identifying Bullish Blocks (Demand)
When the indicator detects a bullish EMA crossover (the fast EMA crosses above the slow EMA), it signals that a new uptrend may be forming.
The indicator then scans the bars before this crossover to find the absolute lowest low price. This extreme low point, and the body of the candle that created it, represents the “Demand Block.” This zone is plotted as a green rectangle and extended into the future. The logic is that this was the last significant level where selling pressure was exhausted and demand took control.
3. Identifying Bearish Blocks (Supply)
Conversely, when the indicator detects a bearish EMA crossover (the fast EMA crosses below the slow EMA), it signals a potential new downtrend.
It scans the bars before this cross to find the absolute highest high price. This extreme high point forms the “Supply Block.” This zone is plotted as a red rectangle, representing the last significant level where buying pressure was exhausted and supply took over.
4. When is a Block “Broken” or Invalidated?
This is the most critical feature. A block remains active (and extended) on the chart until it is “broken” or “mitigated” by price.
- A Bullish (Demand) Block is considered broken when price closes below its low.
- A Bearish (Supply) Block is considered broken when price closes above its high.
This feature allows you to see exactly which zones are still active and which have failed.
5. Visuals & Chart Cleaning
The indicator also includes two features to improve usability:
- EMA Shadow: It can draw a colored cloud (or “shadow”) between the fast and slow EMAs, giving you a clear visual representation of the current trend.
- Overlap Detection: To prevent chart clutter, the indicator uses the Average True Range (ATR) to detect if two new blocks of the same type (e.g., two bullish blocks) are too close together. If they are, it intelligently removes the older, less relevant block.
How to Use the Volume Order Blocks Indicator
As Dynamic Support & Resistance
The most common use for VOB is to identify high-probability support (Demand) and resistance (Supply) levels.
- When price pulls back to an active Demand Block (green), traders can watch for signs of rejection (bounces) as potential long entry signals.
- When price rallies into an active Supply Block (red), traders can watch for signs of rejection as potential short entry signals.
- The midline of the block (which can be toggled on) often acts as a significant level of interest (a 50% retracement) within the zone.
Identifying “Breaks of Structure” (BoS)
The invalidation of a block is just as important as the block itself.
- When price decisively closes below a Demand Block, it signals a “Break of Structure” (BoS) to the downside. This suggests the trend is turning bearish.
- When price decisively closes above a Supply Block, it signals a BoS to the upside, suggesting strong bullish momentum.
Indicator Settings and Configuration
This indicator comes with a wide range of settings to customize its behavior and appearance.
Main Settings
length1(Default: 5): The period for the fast EMA.length2(Default: 18): The period for the slow EMA. Note: The code logic sets this tolength1 + 13.midL(Default: 1 – true): Set to1to display the 50% midline of the order blocks, or0to hide it.trendShadow(Default: 1 – true): Set to1to display the colored cloud between the EMAs, or0to hide it.showLastN(Default: 100): Sets the maximum number of historical blocks to draw on the chart. This helps manage chart performance.showbroken(Default: 1 – true): A very useful setting for analysis. When set to1(true), the indicator will continue to display blocks after they have been broken (they will stop extending). Set to0(false) to have broken blocks disappear immediately.
Color Settings
The indicator provides full control over all visual elements:
col1R, col1G, col1B: RGB color for the bullish EMA shadow.col2R, col2G, col2B: RGB color for the bearish EMA shadow.bullColorR, bullColorG, bullColorB: RGB color for the Bullish (Demand) Blocks.bearColorR, bearColorG, bearColorB: RGB color for the Bearish (Supply) Blocks.
ProRealtime Code
//----------------------------------
// PRC_Volume Order Blocks by BigBeluga
// version = 0
// 12.11.2025
// Iván González @ www.prorealcode.com
// Sharing ProRealTime knowledge
//----------------------------------
DEFPARAM DRAWONLASTBARONLY = TRUE
DEFPARAM CALCULATEONLASTBARS = 500
//----------------------------------
// INPUTS
//----------------------------------
length1 = 5 //
length2 = length1+13 // length1 + 13
midL = 1 // 1=true, 0=false.
trendShadow = 1 // 1=true, 0=false.
showLastN = 100
showbroken = 1 // 1=true, 0=false.
// shadow color
col1R = 38
col1G = 186
col1B = 159
col2R = 102
col2G = 38
col2B = 186
// block color
bullColorR = 38
bullColorG = 186
bullColorB = 159
bearColorR = 102
bearColorG = 38
bearColorB = 186
//----------------------------------
// EMA CALCULATION
//----------------------------------
ema1 = exponentialaverage[length1](close)
ema2 = exponentialaverage[length2](close)

crossUp = (ema1 crosses over ema2)
crossDn = (ema1 crosses under ema2)
//----------------------------------
// Shadow
//----------------------------------
difff = ema2 - ema1
if difff>0 then
   colorShadowR=col2R
   colorShadowG=col2G
   colorShadowB=col2B
else
   colorShadowR=col1R
   colorShadowG=col1G
   colorShadowB=col1B
endif
IF trendShadow THEN
   colorbetween(ema1, ema2,colorShadowR, colorShadowG, colorShadowB, 30)
ENDIF
//----------------------------------
// ATR calculation
//----------------------------------
atrPeriod = 200
myAtr = averagetruerange[atrPeriod](close)
atr = myAtr * 3
atr1 = myAtr * 2
//----------------------------------
//--- Bullish blocks detection
//----------------------------------
ONCE b = 0
IF crossUp THEN
   myLowest = lowest[length2](low)
   myLowestIndex = 0
   vol = 0
   src = 0

   i = 0
   FOR i = 1 TO length2 DO
      IF low[i] = myLowest THEN
         myLowestIndex = barindex[i]
         src = min(open[i], close[i])
         break
      endif
   next

   if myLowestIndex>0 then

      FOR k = 0 TO myLowestIndex DO
         vol = vol + volume[k]
      NEXT

      // ATR
      IF (src - myLowest) < (atr1 * 0.5) THEN
         src = myLowest + atr1 * 0.5
      ENDIF

      // store block
      $bullIndex[b] = myLowestIndex
      $bullUpper[b] = src
      $bullLower[b] = myLowest
      $bullMid[b] = (src + myLowest) / 2
      $bullVol[b] = vol
      $bullIsActive[b] = 1
      $bullValid[b] = 1
      b = b + 1
   ENDIF
ENDIF
//----------------------------------
//--- Bearish blocks detection
//----------------------------------
ONCE z = 0
IF crossDn THEN
   myHighest = highest[length2](high)
   myHighestIndex = 0
   vol = 0
   src = 0

   i = 0
   FOR i = length2 downTO 1 DO
      IF high[i] = myHighest THEN
         myHighestIndex = barindex[i]
         src = max(open[i], close[i])
         break
      endif
   next

   FOR k = 0 TO myHighestIndex DO
      vol = vol + volume[k]
   NEXT

   // ATR
   IF (myHighest - src) < (atr1 * 0.5) THEN
      src = myHighest - atr1 * 0.5
   ENDIF

   // Store block
   $bearIndex[z] = myHighestIndex
   $bearUpper[z] = myHighest
   $bearLower[z] = src
   $bearMid[z] = (src + myHighest) / 2
   $bearVol[z] = vol
   $bearIsActive[z] = 1
   $bearValid[z] = 1
   z = z + 1

ENDIF
//----------------------------------
// PLOT
//----------------------------------
IF islastbarupdate THEN

   // --- 1. BULLISH BLOCKS (Invalidation) ---
   IF b > 0 THEN
      FOR i = 0 TO b - 1 DO
         IF $bullIsActive[i] = 1 THEN
            for j=barindex-$bullIndex[i] downto 0 do
               // A. Crossunder
               IF close[j] < $bullLower[i] THEN
                  $bullIsActive[i] = 0
                  $bullIndexEnd[i] = barindex[j]
                  break
               ENDIF

               // B. Overlap
               IF i > 0 AND $bullIsActive[max(0,i-1)] = 1 THEN
                  dist = abs($bullMid[i] - $bullMid[i-1])
                  IF dist < atr[j] THEN
                     $bullIsActive[i-1] = 0
                     $bullValid[i-1] = 0
                  ENDIF
               ENDIF
            next
         ENDIF
      NEXT
   ENDIF

   // --- 2. BEARISH BLOCKS (Invalidation) ---
   IF z > 0 THEN
      FOR i = 0 TO z - 1 DO
         IF $bearIsActive[i] = 1 THEN
            for j=barindex-$bearIndex[i] downto 0 do
               // A. Crossover
               IF close[j] > $bearUpper[i] THEN
                  $bearIsActive[i] = 0
                  $bearIndexEnd[i] = barindex[j]
                  break
               ENDIF

               // B. Overlap
               IF i > 0 AND $bearIsActive[max(0,i-1)] = 1 THEN
                  dist = abs($bearMid[i] - $bearMid[i-1])
                  IF dist < atr[j] THEN
                     $bearIsActive[i-1] = 0
                     $bearValid[i-1] = 0
                  ENDIF
               ENDIF
            next
         ENDIF
      NEXT
   ENDIF

   // --- 3. BULLISH BLOCKS ---
   IF b > 0 THEN
      startIndex = max(0, b - showLastN)
      FOR i = startIndex TO b - 1 DO
         IF $bullIsActive[i] = 1 THEN

            DRAWRECTANGLE($bullIndex[i], $bullLower[i], barindex, $bullUpper[i]) COLOURED(bullColorR, bullColorG, bullColorB) FILLCOLOR(bullColorR, bullColorG, bullColorB, 80)

            IF midL THEN
               DRAWSEGMENT($bullIndex[i], $bullMid[i], barindex, $bullMid[i]) COLOURED(bullColorR, bullColorG, bullColorB) STYLE(dottedline)
            ENDIF

            bullvol= $bullVol[i]
            drawtext("#bullvol#",barindex+5,$bullMid[i])

         elsif $bullValid[i] = 1 AND showbroken then
            DRAWRECTANGLE($bullIndex[i], $bullLower[i], $bullIndexEnd[i], $bullUpper[i]) COLOURED(bullColorR, bullColorG, bullColorB,80) FILLCOLOR(bullColorR, bullColorG, bullColorB, 40)

         ENDIF
      NEXT
   ENDIF

   // --- 4. BEARISH BLOCKS ---
   IF z > 0 THEN
      startIndex = max(0, z - showLastN)
      FOR i = startIndex TO z - 1 DO
         IF $bearIsActive[i] = 1 THEN

            DRAWRECTANGLE($bearIndex[i], $bearLower[i], barindex, $bearUpper[i]) COLOURED(bearColorR, bearColorG, bearColorB) FILLCOLOR(bearColorR, bearColorG, bearColorB, 80)

            IF midL THEN
               DRAWSEGMENT($bearIndex[i], $bearMid[i], barindex, $bearMid[i]) COLOURED(bearColorR, bearColorG, bearColorB) STYLE(dottedline)
            ENDIF

            bearvol= $bearVol[i]
            drawtext("#bearvol#",barindex+5,$bearMid[i])

         elsif $bearValid[i] = 1 AND showbroken then
            DRAWRECTANGLE($bearIndex[i], $bearLower[i], $bearIndexEnd[i], $bearUpper[i]) COLOURED(bearColorR, bearColorG, bearColorB,80) FILLCOLOR(bearColorR, bearColorG, bearColorB, 40)
         ENDIF
      NEXT
   ENDIF

ENDIF
//----------------------------------
RETURN ema1 as "EMA fast", ema2 as "EMA slow"
