Volume Flow Indicator
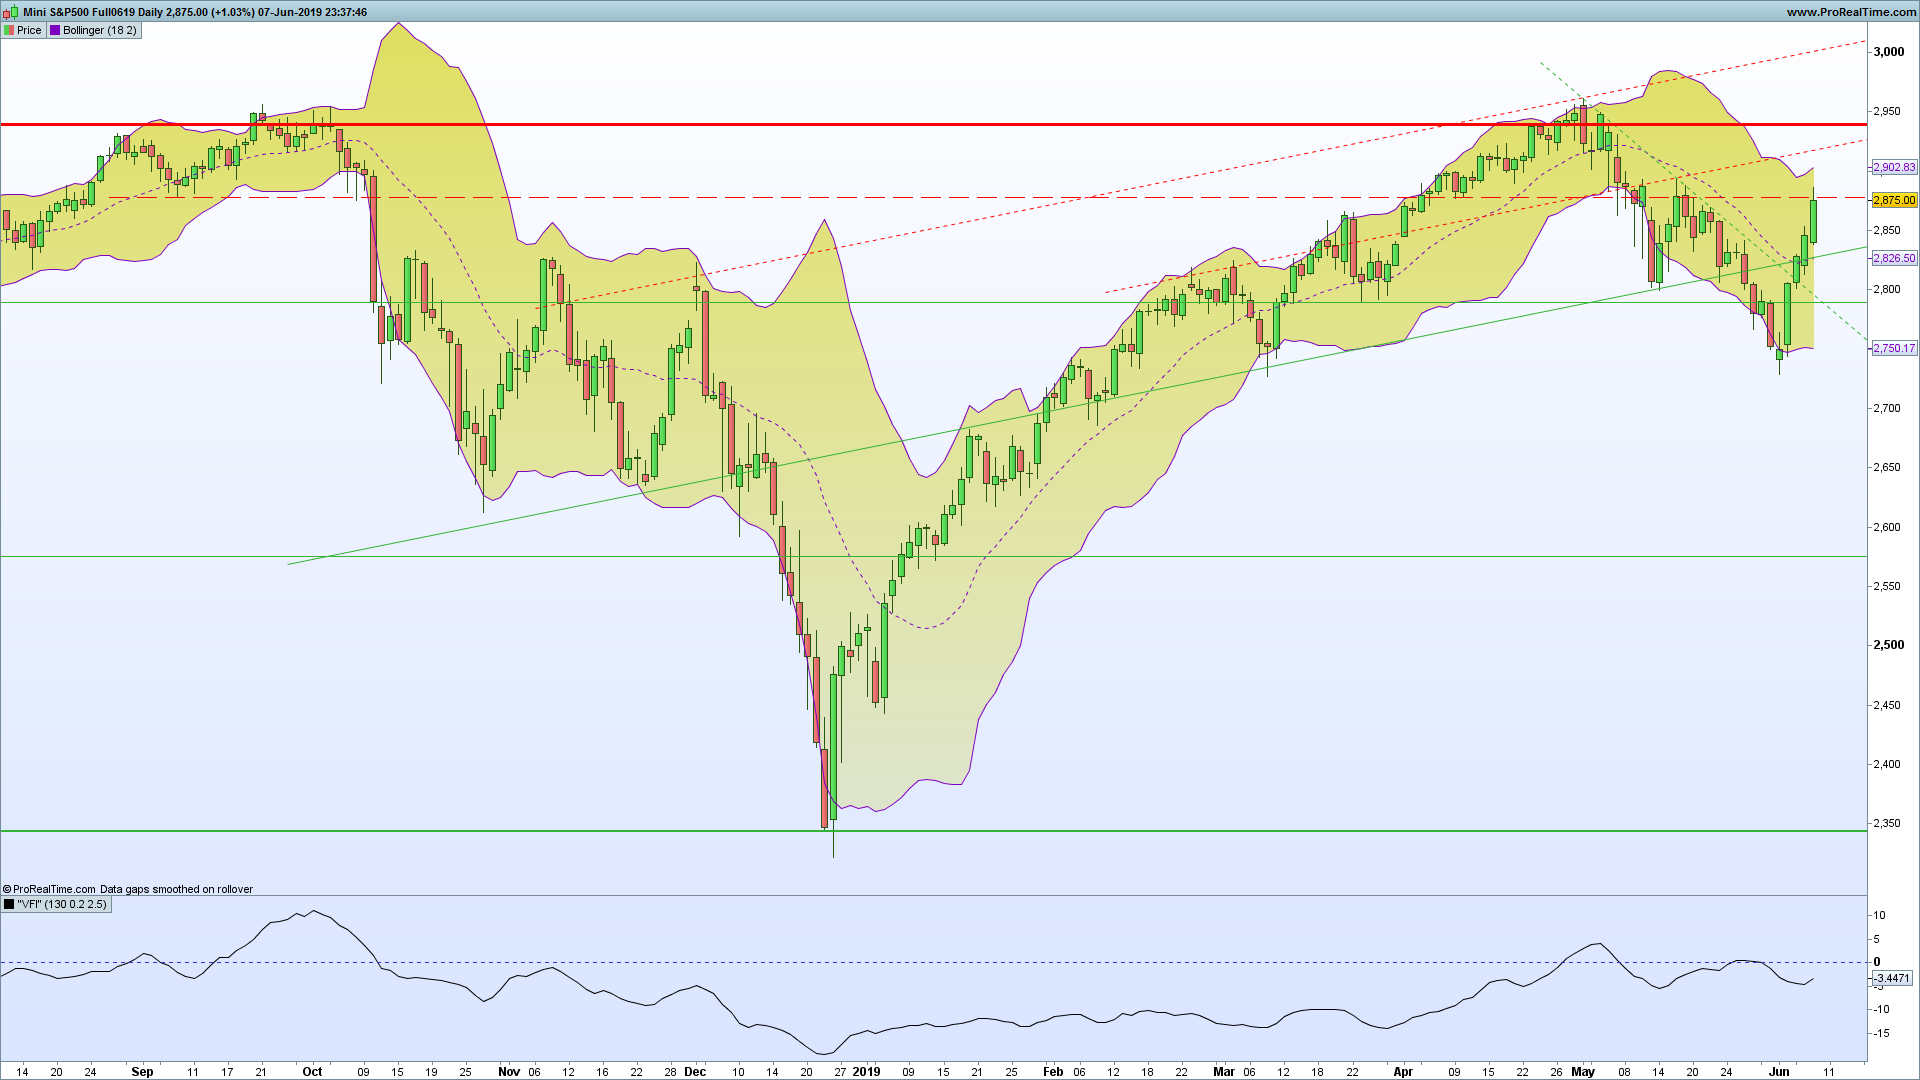
VOLUME FLOW INDICATOR (VFI) Provided By : MARKOS KATSANOS Copyright 2004
VFI,introduced by Markos Katsanos, is based on the popular On Balance Volume (OBV) but with three very important modifications:
* Unlike the OBV, indicator values are no longer meaningless. Positive readings are bullish and negative bearish .
* The calculation is based on the day’s median (typical price) instead of the closing price.
* A volatility threshold takes into account minimal price changes and another threshold eliminates excessive volume .
A simplified interpretation of the VFI is:
* Values above zero indicate a bullish state and the crossing of the zero line is the trigger or buy signal.
* The strongest signal with all money flow indicators is of course divergence.
For more information see Markos Katsanos’s articles in the
June 2004 and July 2004 issues of Technical Analysis of Stocks & Commodities magazine.
Period=days for VFI calculation
Coef=coefficient for minimal price cut-of (use 0.2 for daily and 0.1
for intraday 5-15 min data)
Vcoef=coefficient for volume cut-off (use 2.5 for daily and 3.5 for intraday charts)}
// VFI By Zilliq
//
// Period=130 (corresponding to 6 months)
// Coef=coefficient for minimal price cut-of (use 0.2 for daily and 0.1 for intraday 5-15 min data)
// Vcoef=coefficient for volume cut-off (use 2.5 for daily and 3.5 for intraday charts)}

Period = 130
Coef=0.1
Vcoef = 3.5

TP = TypicalPrice

if TP > 0 and TP[1] > 0 then
Inter = Log(TP) - Log(TP[1])
else
Inter = 0
endif

//inter=log(typicalprice)-log(typicalprice[1])

vinter=STD[30](inter)

cutoff=coef*vinter*close

vaveset=average[period](volume)

vave=vaveset[1]

vmax=vave*vcoef

if volume<vmax then
vc=volume
else
vc=vmax
endif

mf=typicalprice-typicalprice[1]

if mf>cutoff then
vc=vc
elsif mf<-cutoff then
vc=-vc
else
vc=0
endif
vfii=summation[period](vc)/vave

vfimov=exponentialaverage[3](vfii)


return vfimov as "VFI"