

Volume-by-price levels V2 Extended
Hi Coders,
This is an improved version of 2 indicators made by Nicolas and unified and modified by myself.
(https://www.prorealcode.com/topic/prc_quickfibtl/)
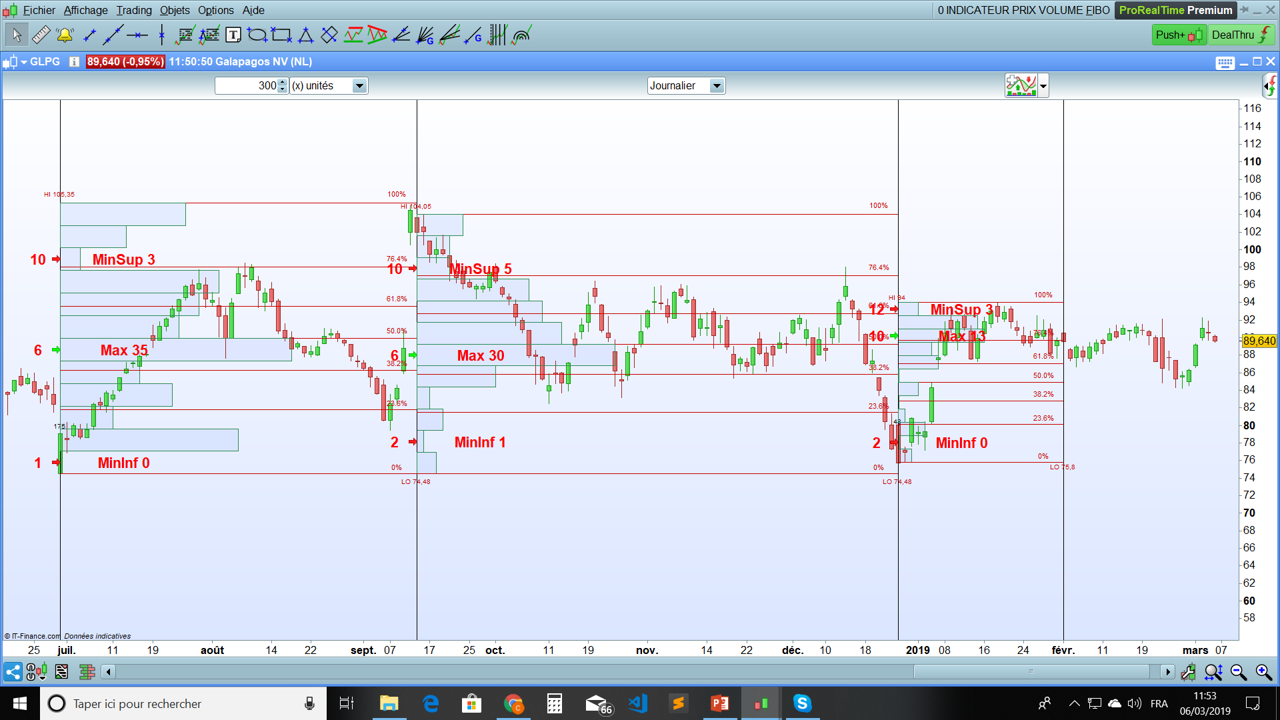
I needed further options to develop a simple strategy: identify strength and weakness in the distribution of volume per price :
- Max (strong level of volume per price => resistance or support depending on the position of the price)
- MinSup (week segment of price above the Max)
- MinInf (week segment of price under the Max=
The first idea behind is that if the price crosses over (respectively under) the strong volume level (“Max”), the price will tend to test a week point in the distribution of volume per price, respectively either superior (“MinSup”) or inferior (“MinInf”).
A second idea would be to use a section of StartHighest/EndLowest (respectively StartLowest/EndHighest) to set entry point if the price crosses over MinInf (respectively MinSup) and use Fibonacci to have a trailing stop.
I will open a new thread in ProOrder so that we can discuss this;
Please feel free to give to this code some enhancements or correct it if you see errors.
>>> Next steps :
- to automatise the sequences with new LowestLows and HighestHigh that we do here manually: any idea guys?
Enjoy
Chris
defparam drawonlastbaronly=true

// The main goal of this indicator is to identify strengh and weekness in the distribution of volume per price
// The main idea of the strategy behind is that the price will tend to reach a week point in the distribution repsectively either superior ("MinSup") or // inférior ("MinInf") if the price crosses over or under the strong volume level ("Max").

//VolumeByPrice HighLowBreakdown (mods by Kris75)
//PRC_Bull&Bear Volume on Price | indicator
//05.07.2018
//Nicolas @ www.prorealcode.com
//Sharing ProRealTime knowledge


/////////////////////

StartHighest = 0
StartLowest = 0
EndHighest = 0
EndLowest= 0
CustomEnd= 0
BreakDown= 0
//Fibonacci= 1
Invert= 0
DefaultLookBack= 200
NbOfBars= 50 // for the CustomEnd
NbOfDiv= 12  // division of the range in x divisions/segments
ScaleFactor= 1 // multiplier of volume for graphic needs


if StartHighest then // if choice to start at the highest of the default lookback period

StartVol=highest[DefaultLookBack](high)
for j=DefaultLookBack downto 0 do
if high[j]=StartVol then
StartBar = j
break
endif
next

if EndLowest then // if choice to end at the lowest since the highest
StartBar = max(1,StartBar)
EndVol=lowest[StartBar](low)
for k=StartBar downto 0 do
if low[k]=EndVol then
EndBar = k
break
endif
next

EndBar = max(1,EndBar)
volsum = summation [StartBar](volume)-summation [EndBar](volume) // (total volumme from StartBar to 0) - (volume of the Endbar to 0)

hh=highest[StartBar](high)
ll=lowest[StartBar](low)
div = (hh-ll)/NbOfDiv

elsif CustomEnd then // if choice to have a specific End
if NbOfBars < StartBar then

StartBar = max(1,StartBar)
EndBar = StartBar - NbOfBars

EndBar = max(1,EndBar)
volsum = summation [StartBar](volume)-summation [EndBar](volume)

LowestLowSection = low[StartBar]
for lls = StartBar downto Endbar
if low[lls]<LowestLowSection then
LowestLowSection = low[lls]
endif
next

hh=highest[StartBar](high)
ll=LowestLowSection
div = (hh-ll)/NbOfDiv


else
EndBar = 0 //
StartBar = max(1,StartBar)
volsum = summation [StartBar](volume)

hh=highest[StartBar](high)
ll=lowest[StartBar](low)
div = (hh-ll)/NbOfDiv

endif
else
EndBar = 0 //
StartBar = max(1,StartBar)
volsum = summation [StartBar](volume)

hh=highest[StartBar](high)
ll=lowest[StartBar](low)
div = (hh-ll)/NbOfDiv
endif


elsif StartLowest then // if choice to start at the lowest of the default lookback period
StartVol=lowest[DefaultLookBack](low)
for m=DefaultLookBack downto 0 do
if low[m]=StartVol then
StartBar = m
drawtext("#StartBar#",barindex[m],high[m])
break
endif
next

if EndHighest then
StartBar = max(1,StartBar)
EndVol=highest[StartBar](high)
for n=StartBar downto 0 do
if high[n]=EndVol then
EndBar = n
break
endif
next

EndBar = max(1,EndBar)
volsum = summation [StartBar](volume)-summation [EndBar](volume)

hh=highest[StartBar](high)
ll=lowest[StartBar](low)
div = (hh-ll)/NbOfDiv

elsif CustomEnd then
if NbOfBars < StartBar then

StartBar = max(1,StartBar)
EndBar = StartBar - NbOfBars

EndBar = max(1,EndBar)
volsum = summation [StartBar](volume)-summation [EndBar](volume)

HighestHighSection = high[StartBar]
for hhs = StartBar downto Endbar do
if high[hhs]>HighestHighSection then
HighestHighSection = high[hhs]

endif
next

hh=HighestHighSection
ll=lowest[StartBar](low)
div = (hh-ll)/NbOfDiv

else
EndBar = 0 //
StartBar = max(1,StartBar)
volsum = summation [StartBar](volume)

hh=highest[StartBar](high)
ll=lowest[StartBar](low)
div = (hh-ll)/NbOfDiv

endif
else
EndBar = 0 //
StartBar = max(1,StartBar)
volsum = summation [StartBar](volume)

hh=highest[StartBar](high)
ll=lowest[StartBar](low)
div = (hh-ll)/NbOfDiv

endif


elsif  CustomEnd then

if NbOfBars < DefaultLookBack then

StartBar = max(1,DefaultLookBack)
EndBar = StartBar - NbOfBars

EndBar = max(1,EndBar)
volsum = summation [StartBar](volume)-summation [EndBar](volume)

HighestHighSection = high[StartBar]
for hhs = StartBar downto Endbar do
if high[hhs]>HighestHighSection then
HighestHighSection = high[hhs]

endif
next

LowestLowSection = low[StartBar]
for lls = StartBar downto Endbar
if low[lls]<LowestLowSection then
LowestLowSection = low[lls]
endif
next

hh=HighestHighSection
ll=LowestLowSection
div = (hh-ll)/NbOfDiv

else
EndBar = 0 //
StartBar = max(1,StartBar)
volsum = summation [StartBar](volume)

hh=highest[StartBar](high)
ll=lowest[StartBar](low)
div = (hh-ll)/NbOfDiv

endif


else
StartBar = DefaultLookBack
EndBar = 0 // if no choice of the highest / lowest  => EndBar is 0
volsum = summation [DefaultLookBack](volume)

hh=highest[StartBar](high)
ll=lowest[StartBar](low)
div = (hh-ll)/NbOfDiv

endif

drawvline(barindex[StartBar])
drawvline(barindex[Endbar])

StartBar = max(1,StartBar)
Endbar = max(1,Endbar)


i=0

StartbarIndex = barindex[StartBar]
EndbarIndex = barindex[EndBar]


//// creation of the variables identifying MinInf, MinSup and Max

lrangeminInf = 0
hrangeminInf = 0
lrangeminSup = 0
hrangeminSup = 0
lrangemax = 0
hrangemax = 0
MaxVol = 0
NumBarVol = 0
NumBarMaxVol = 0
NumBarMinVolSup = 0
NumBarMinVolInf = 0

while i<NbOfDiv do
lrange=ll+div*i
hrange=lrange+div
volbull=0
volbear=0
NumBarVol = i+1

for q = Endbar to StartBar do
if close[q]>=lrange and close[q]<=hrange then
if close[q]>open[q] then
volbull=volbull+volume[q]
else
volbear=volbear+volume[q]
endif
endif
next
bullbar = round((volbull*StartBar)/volsum)*scalefactor
bearbar = round((volbear*StartBar)/volsum)*scalefactor
volbar = round(((volbear+volbull)*StartBar)/volsum)*scalefactor


if i=0 then

lrangemax = lrange
hrangemax = hrange
MaxVol = volbar
NumBarMaxVol = NumBarVoL

lrangeminSup = lrange
hrangeminSup = hrange
MinVolSup = VolBar
NumBarMinVolSup = NumBarVol

lrangeminInf = lrange
hrangeminInf = hrange
MinVolInf = VolBar
NumBarMinVolInf = NumBarVol

endif

if volbar > MaxVol then
lrangemax = lrange
hrangemax = hrange
MaxVol = volbar
NumBarMaxVol = NumBarVol

if MinVolSup < MinVolInf then
lrangeminInf = lrangeminSup
hrangeminInf = hrangeminSup
MinVolInf = MinVolSup
NumBarMinVolInf = NumBarMinVolSup
endif

lrangeminSup = lrange
hrangeminSup = hrange
MinVolSup = VolBar
NumBarMinVolSup = NumBarVol

elsif volbar < MaxVol then
if volbar < MinVolSup then
lrangeminSup = lrange
hrangeminSup = hrange
MinVolSup = VolBar
NumBarMinVolSup = NumBarVol
endif

else
lrangeminInf = lrangeminInf
hrangeminInf = hrangeminInf
MinVolInf = MinVolInf
NumBarMinVolInf = NumBarMinVolInf

endif


if breakdown then

drawrectangle(StartbarIndex,lrange,StartbarIndex+bullbar,hrange) coloured(46,139,87,255)
drawrectangle(StartbarIndex,lrange,StartbarIndex+bearbar,hrange) coloured(255,0,0,255)

if bullbar>bearbar then
drawtext("■",StartbarIndex+bullbar,(lrange+hrange)/2,Dialog,Bold,22) coloured(46,139,87)
else
drawtext("■",StartbarIndex+bearbar,(lrange+hrange)/2,Dialog,Bold,22) coloured(255,0,0)
endif
drawvline(barindex[DefaultLookBack])
elsif not breakdown then

drawrectangle(StartbarIndex,lrange,StartbarIndex+volbar,hrange) coloured(46,139,87,255)
endif

i=i+1
wend

MaxVolumLevel = (lrangemax + hrangemax)/2
MinVolumSupLevel = (lrangeminSup + hrangeminSup)/2
MinVolumInfLevel = (lrangeminInf + hrangeminInf)/2

DRAWARROW (StartbarIndex, MaxVolumLevel) COLOURED (0, 255, 0)
DRAWARROW (StartbarIndex, MinVolumSupLevel) COLOURED (255, 0, 0)
DRAWARROW (StartbarIndex, MinVolumInfLevel) COLOURED (255, 0, 0)


drawtext("#NumBarMaxVol#",StartbarIndex-3,MaxVolumLevel,Dialog,Bold,22) coloured(255,0,0)
drawtext("#NumBarMinVolSup#",StartbarIndex-3,MinVolumSupLevel,Dialog,Bold,22) coloured(255,0,0)
drawtext("#NumBarMinVolInf#",StartbarIndex-3,MinVolumInfLevel,Dialog,Bold,22) coloured(255,0,0)

drawtext("MinInf #MinVolInf#",StartbarIndex+10,MinVolumInfLevel,Dialog,Bold,22) coloured(255,0,0)
drawtext("MinSup #MinVolSup#",StartbarIndex+10,MinVolumSupLevel,Dialog,Bold,22) coloured(255,0,0)
drawtext("Max #MaxVol#",StartbarIndex+10,MaxVolumLevel,Dialog,Bold,22) coloured(255,0,0)


// Fibo

StartFibo = max(1,StartbarIndex)
EndFibo = max(1,EndbarIndex)

isSwingDown = StartFibo < EndFibo

if isSwingDown then
fullrange = abs(hh-ll)
fibo100   = hh
fibo0     = ll
fibo236   = ll+(fullrange*0.236)
fibo382   = ll+(fullrange*0.382)
fibo50    = ll+fullrange/2
fibo618   = ll+(fullrange*0.618)
fibo764   = ll+(fullrange*0.764)

r = 200
g = 0
b = 0
DrawText("HI #hh#",StartFibo,hh+fullrange*0.03,dialog,standard,10) coloured(r,g,b) // plot price at 0% and 100% levels
DrawText("LO #ll#",EndFibo,ll-fullrange*0.03,dialog,standard,10) coloured(r,g,b)
else
fullrange = abs(hh-ll)
fibo100   = ll
fibo0     = hh
fibo236   = hh-(fullrange*0.236)
fibo382   = hh-(fullrange*0.382)
fibo50    = hh-fullrange/2
fibo618   = hh-(fullrange*0.618)
fibo764   = hh-(fullrange*0.764)

r = 0
g = 200
b = 0
DrawText("HI #hh#",StartFibo,hh+fullrange*0.03,dialog,standard,10) coloured(r,g,b) // plot price at 0% and 100% levels
DrawText("LO #ll#",EndFibo,ll-fullrange*0.03,dialog,standard,10) coloured(r,g,b)
endif

if invert = 0 then // plot fibonacci levels
DrawSegment(barindex[StartBar],fibo0,barindex[EndBar],fibo0) coloured(r,g,b)
DrawText("0%",barindex[EndBar]-3,fibo0*1.01,Dialog,Standard,11) coloured(r,g,b)
DrawSegment(barindex[StartBar],fibo236,barindex[EndBar],fibo236) coloured(r,g,b)
DrawText("23.6%",barindex[EndBar]-3,fibo236*1.01,Dialog,Standard,11) coloured(r,g,b)
DrawSegment(barindex[StartBar],fibo382,barindex[EndBar],fibo382) coloured(r,g,b)
DrawText("38.2%",barindex[EndBar]-3,fibo382*1.01,Dialog,Standard,11) coloured(r,g,b)
DrawSegment(barindex[StartBar],fibo50,barindex[EndBar],fibo50) coloured(r,g,b)
DrawText("50.0%",barindex[EndBar]-3,fibo50*1.01,Dialog,Standard,11) coloured(r,g,b)
DrawSegment(barindex[StartBar],fibo618,barindex[EndBar],fibo618) coloured(r,g,b)
DrawText("61.8%",barindex[EndBar]-3,fibo618*1.01,Dialog,Standard,11) coloured(r,g,b)
DrawSegment(barindex[StartBar],fibo764,barindex[EndBar],fibo764) coloured(r,g,b)
DrawText("76.4%",barindex[EndBar]-3,fibo764*1.01,Dialog,Standard,11) coloured(r,g,b)
DrawSegment(barindex[StartBar],fibo100,barindex[EndBar],fibo100) coloured(r,g,b)
DrawText("100%",barindex[EndBar]-3,fibo100*1.01,Dialog,Standard,11) coloured(r,g,b)
elsif invert = 1 then // plot invert fibonacci levels
DrawSegment(barindex[StartBar],fibo0,barindex[EndBar],fibo0) coloured(r,g,b)
DrawText("100%",barindex[EndBar],fibo0,Dialog,Standard,11) coloured(r,g,b)
DrawSegment(barindex[StartBar],fibo236,barindex[EndBar],fibo236) coloured(r,g,b)
DrawText("76.4%",barindex[EndBar],fibo236,Dialog,Standard,11) coloured(r,g,b)
DrawSegment(barindex[StartBar],fibo382,barindex[EndBar],fibo382) coloured(r,g,b)
DrawText("61.8%",barindex[EndBar],fibo382,Dialog,Standard,11) coloured(r,g,b)
DrawSegment(barindex[StartBar],fibo50,barindex[EndBar],fibo50) coloured(r,g,b)
DrawText("50.0%",barindex[EndBar],fibo50,Dialog,Standard,11) coloured(r,g,b)
DrawSegment(barindex[StartBar],fibo618,barindex[EndBar],fibo618) coloured(r,g,b)
DrawText("38.2%",barindex[EndBar],fibo618,Dialog,Standard,11) coloured(r,g,b)
DrawSegment(barindex[StartBar],fibo764,barindex[EndBar],fibo764) coloured(r,g,b)
DrawText("23.6%",barindex[EndBar],fibo764,Dialog,Standard,11) coloured(r,g,b)
DrawSegment(barindex[StartBar],fibo100,barindex[EndBar],fibo100) coloured(r,g,b)
DrawText("0%",barindex[EndBar],fibo100,Dialog,Standard,11) coloured(r,g,b)
endif

return