

Volume analysis - intraday
January 7, 2020, 2:51 PM
Indicators
2 Comments
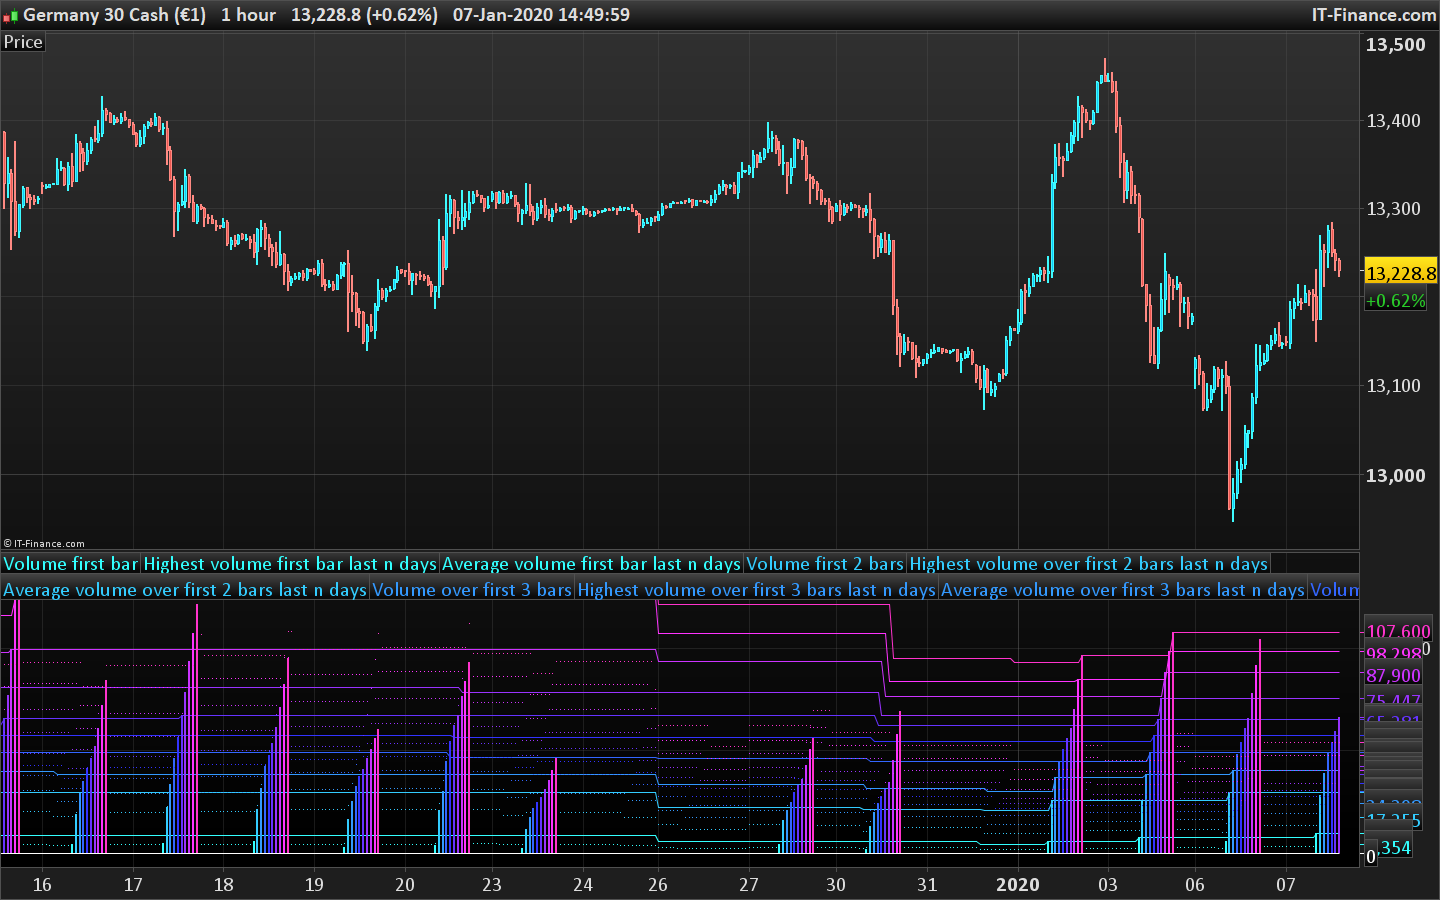
I created this simple indicator to gauge volume of opening bars relative to previous days (can specify how many using the variable) – volume is much more meaningful when evaluated relative to prior periods than in isolation in my view. I originally thought it would be a good forward indicator of trend, but there doesn’t appear to be a clear relationship. It’s quite a busy indicator and I would take any suggestions about how to clean it up. Getting rid of the series of points and solid lines that mark the averages and highest volume numbers either side of the histograms would be a good start, but I don’t think PRT will let me do that.
b=8

StartTime = 080000

i = IntradayBarIndex

IF i < i[1] THEN
x = i[1]
ENDIF

IF Time = StartTime THEN
Marker = i
ENDIF

//
IF i = 0 THEN
CumulativeVolume = 0
ELSIF i >= Marker+1 THEN
CumulativeVolume = Volume + CumulativeVolume
ENDIF

//
IF i = Marker+1 THEN
VolumeFirstBar = CumulativeVolume
ELSE
VolumeFirstBar = 0
ENDIF
IF i = Marker+2 THEN
VolumeFirst2Bars = CumulativeVolume
ELSE
VolumeFirst2Bars = 0
ENDIF
IF i = Marker+3 THEN
VolumeFirst3Bars = CumulativeVolume
ELSE
VolumeFirst3Bars = 0
ENDIF
IF i = Marker+4 THEN
VolumeFirst4Bars = CumulativeVolume
ELSE
VolumeFirst4Bars = 0
ENDIF
IF i = Marker+5 THEN
VolumeFirst5Bars = CumulativeVolume
ELSE
VolumeFirst5Bars = 0
ENDIF
IF i = Marker+6 THEN
VolumeFirst6Bars = CumulativeVolume
ELSE
VolumeFirst6Bars = 0
ENDIF
IF i = Marker+7 THEN
VolumeFirst7Bars = CumulativeVolume
ELSE
VolumeFirst7Bars = 0
ENDIF
IF i = Marker+8 THEN
VolumeFirst8Bars = CumulativeVolume
ELSE
VolumeFirst8Bars = 0
ENDIF
IF i = Marker+9 THEN
VolumeFirst9Bars = CumulativeVolume
ELSE
VolumeFirst9Bars = 0
ENDIF
IF i = Marker+10 THEN
VolumeFirst10Bars = CumulativeVolume
ELSE
VolumeFirst10Bars = 0
ENDIF

IF x >= 1 THEN
HighestVolumeFirstBar = ROUND(Highest[(x+1)*b](VolumeFirstBar))
AverageVolumeFirstBar = ROUND((Summation[(x+1)*b](VolumeFirstBar))/b)
HighestVolumeFirst2Bars = ROUND(Highest[(x+1)*b](VolumeFirst2Bars))
AverageVolumeFirst2Bars = ROUND((Summation[(x+1)*b](VolumeFirst2Bars))/b)
HighestVolumeFirst3Bars = ROUND(Highest[(x+1)*b](VolumeFirst3Bars))
AverageVolumeFirst3Bars = ROUND((Summation[(x+1)*b](VolumeFirst3Bars))/b)
HighestVolumeFirst4Bars = ROUND(Highest[(x+1)*b](VolumeFirst4Bars))
AverageVolumeFirst4Bars = ROUND((Summation[(x+1)*b](VolumeFirst4Bars))/b)
HighestVolumeFirst5Bars = ROUND(Highest[(x+1)*b](VolumeFirst5Bars))
AverageVolumeFirst5Bars = ROUND((Summation[(x+1)*b](VolumeFirst5Bars))/b)
HighestVolumeFirst6Bars = ROUND(Highest[(x+1)*b](VolumeFirst6Bars))
AverageVolumeFirst6Bars = ROUND((Summation[(x+1)*b](VolumeFirst6Bars))/b)
HighestVolumeFirst7Bars = ROUND(Highest[(x+1)*b](VolumeFirst7Bars))
AverageVolumeFirst7Bars = ROUND((Summation[(x+1)*b](VolumeFirst7Bars))/b)
HighestVolumeFirst8Bars = ROUND(Highest[(x+1)*b](VolumeFirst8Bars))
AverageVolumeFirst8Bars = ROUND((Summation[(x+1)*b](VolumeFirst8Bars))/b)
HighestVolumeFirst9Bars = ROUND(Highest[(x+1)*b](VolumeFirst9Bars))
AverageVolumeFirst9Bars = ROUND((Summation[(x+1)*b](VolumeFirst9Bars))/b)
HighestVolumeFirst10Bars = ROUND(Highest[(x+1)*b](VolumeFirst10Bars))
AverageVolumeFirst10Bars = ROUND((Summation[(x+1)*b](VolumeFirst10Bars))/b)
ENDIF

RETURN VolumeFirstBar COLOURED(51, 255, 255) STYLE(Histogram) AS "Volume first bar", HighestVolumeFirstBar COLOURED(51, 255, 255) AS "Highest volume first bar last n days", AverageVolumeFirstBar COLOURED(51, 255, 255) STYLE(Point) AS "Average volume first bar last n days", VolumeFirst2Bars COLOURED(51, 204, 255) STYLE(Histogram) AS "Volume first 2 bars", HighestVolumeFirst2Bars COLOURED(51, 204, 255) AS "Highest volume over first 2 bars last n days", AverageVolumeFirst2Bars COLOURED(51, 204, 255) STYLE(Point) AS "Average volume over first 2 bars last n days", VolumeFirst3Bars COLOURED(51, 153, 255) STYLE(Histogram) AS "Volume over first 3 bars", HighestVolumeFirst3Bars COLOURED(51, 153, 255) AS "Highest volume over first 3 bars last n days", AverageVolumeFirst3Bars COLOURED(51, 153, 255) STYLE(Point) AS "Average volume over first 3 bars last n days", VolumeFirst4Bars COLOURED(51, 102, 255) STYLE(Histogram) AS "Volume over first 4 bars", HighestVolumeFirst4Bars COLOURED(51, 102, 255) AS "Highest volume over first 4 bars last n days", AverageVolumeFirst4Bars COLOURED(51, 102, 255) STYLE(Point) AS "Average volume over first 4 bars last n days", VolumeFirst5Bars COLOURED(51, 51, 255) STYLE(Histogram) AS "Volume over first 5 bars", HighestVolumeFirst5Bars COLOURED(51, 51, 255) AS "Highest volume over first 5 bars last n days", AverageVolumeFirst5Bars COLOURED(51, 51, 255) STYLE(Point) AS "Average volume over first 5 bars last n days", VolumeFirst6Bars COLOURED(102, 51, 255) STYLE(Histogram) AS "Volume over first 6 bars", HighestVolumeFirst6Bars COLOURED(102, 51, 255) AS "Highest volume over first 6 bars last n days", AverageVolumeFirst6Bars COLOURED(102, 51, 255) STYLE(Point) AS "Average volume over first 6 bars last n days", VolumeFirst7Bars COLOURED(153, 51, 255) STYLE(Histogram) AS "Volume over first 7 bars", HighestVolumeFirst7Bars COLOURED(153, 51, 255) AS "Highest volume over first 7 bars last n days", AverageVolumeFirst7Bars COLOURED(153, 51, 255) STYLE(Point) AS "Average volume over first 7 bars last n days", VolumeFirst8Bars COLOURED(204, 51, 255) STYLE(Histogram) AS "Volume over first 8 bars", HighestVolumeFirst8Bars COLOURED(204, 51, 255) AS "Highest volume over first 8 bars last n days", AverageVolumeFirst8Bars COLOURED(204, 51, 255) STYLE(Point) AS "Average volume over first 8 bars last n days", VolumeFirst9Bars COLOURED(255, 51, 255) STYLE(Histogram) AS "Volume over first 9 bars", HighestVolumeFirst9Bars COLOURED(255, 51, 255) AS "Highest volume over first 9 bars last n days", AverageVolumeFirst9Bars COLOURED(255, 51, 255) STYLE(Point) AS "Average volume over first 9 bars last n days", VolumeFirst10Bars COLOURED(255, 51, 204) STYLE(Histogram) AS "Volume over first 10 bars", HighestVolumeFirst10Bars COLOURED(255, 51, 204) AS "Highest volume over first 10 bars last n days", AverageVolumeFirst10Bars COLOURED(255, 51, 204) STYLE(Point) AS "Average volume over first 10 bars last n days", 0 COLOURED(0, 0, 0) AS "Zero line"
Download
Filename:
Volume-analysis.itf
Downloads:
224
Senior
As an architect of digital worlds, my own description remains a mystery. Think of me as an undeclared variable, existing somewhere in the code.
Author’s Profile
Loading...