

Volatility Quality zero line
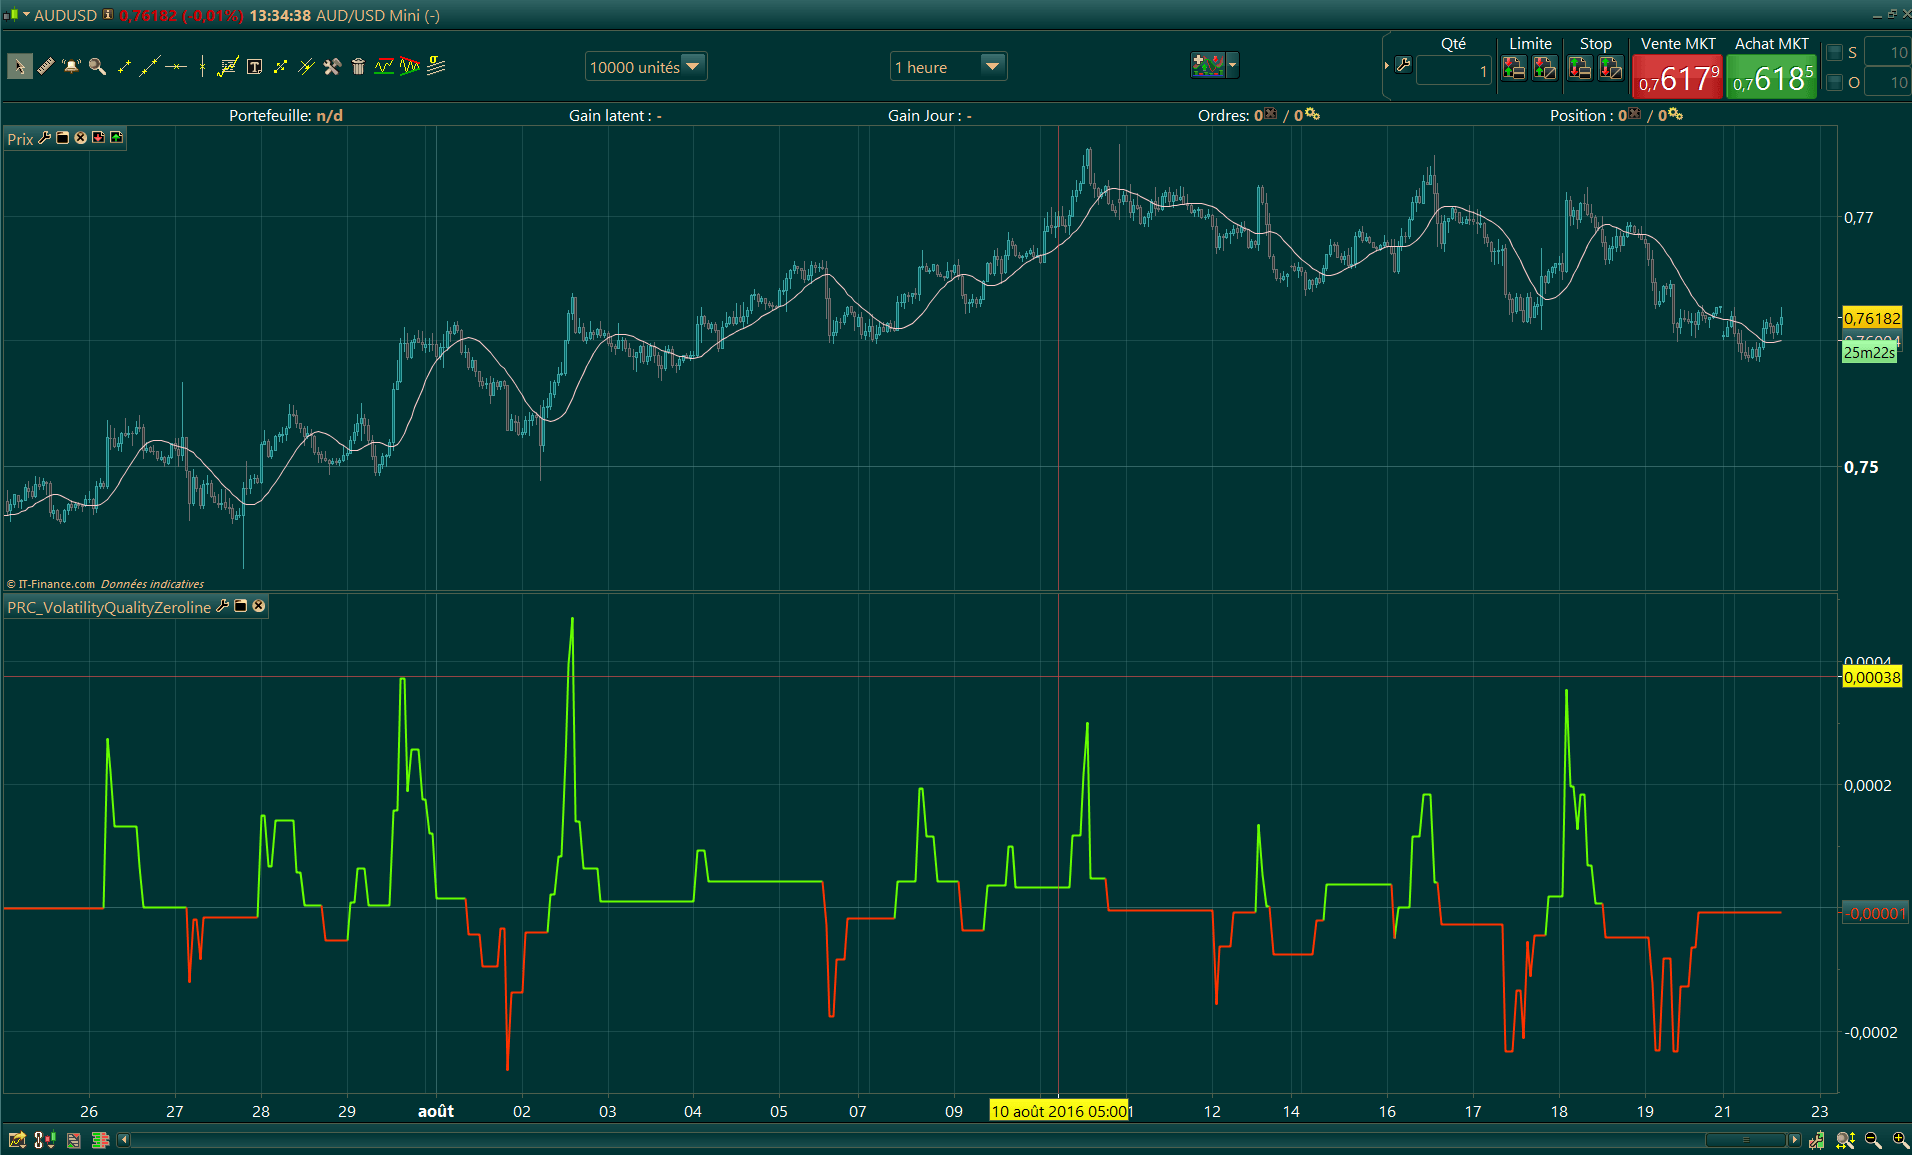
This technical indicator plot the current market volatility with trend direction signals. If the curve is above the zero line, market is bullish, if it is below, market is bearish.
It is calculated with recent market range compounded from the OHLC values of Weighted moving average. The pro of this indicator is that it can’t avoid ranging market because of its embedded volatility filter : when you are already in a trend, no inverse signal will be given unless a new reversal volatility is detected. The con is that because of its smoothing over the last 15 periods (default parameter), trend catching maybe a little late to appear on screen.
I found the idea original and smart enough to be converted to prorealtime code, so enjoy it and make your own idea about it.
Converted from MT4 code.
//---parameters
PriceSmoothing = 15
Filter = 5

cHigh = weightedaverage[PriceSmoothing](high)
cLow = weightedaverage[PriceSmoothing](low)
cOpen = weightedaverage[PriceSmoothing](open)
cClose = weightedaverage[PriceSmoothing](close)
pClose = cClose[1]

trueRange = max(cHigh,cClose) - min(cLow,pClose)
rrange = cHigh-cLow

if rrange<>0 and trueRange<>0 then
 vqi = ((cClose-pClose)/trueRange + (cClose-cOpen)/rrange)*0.5
else
 vqi = vqi[1]
endif

vqi = abs(vqi)*(cClose-pClose+cClose-cOpen)*0.5
sumVqi = vqi

if Filter>0 then
 if abs(sumVqi-sumVqi[1])<(Filter*ticksize) then
  sumVqi = sumVqi[1]
 endif
endif

if sumVqi > 0 then
 color = 1
else
 color = -1
endif

return sumVqi coloured by color