




More from ProRealCode
ProRealCode - Trading & Coding with ProRealTime™
The ProRealTime™ community on the web! Officially sharing ProRealTime knowledge to Worldwide users since 2015!



Volatility Explosive Measure
March 14, 2022, 11:35 AM
Indicators
6 Comments
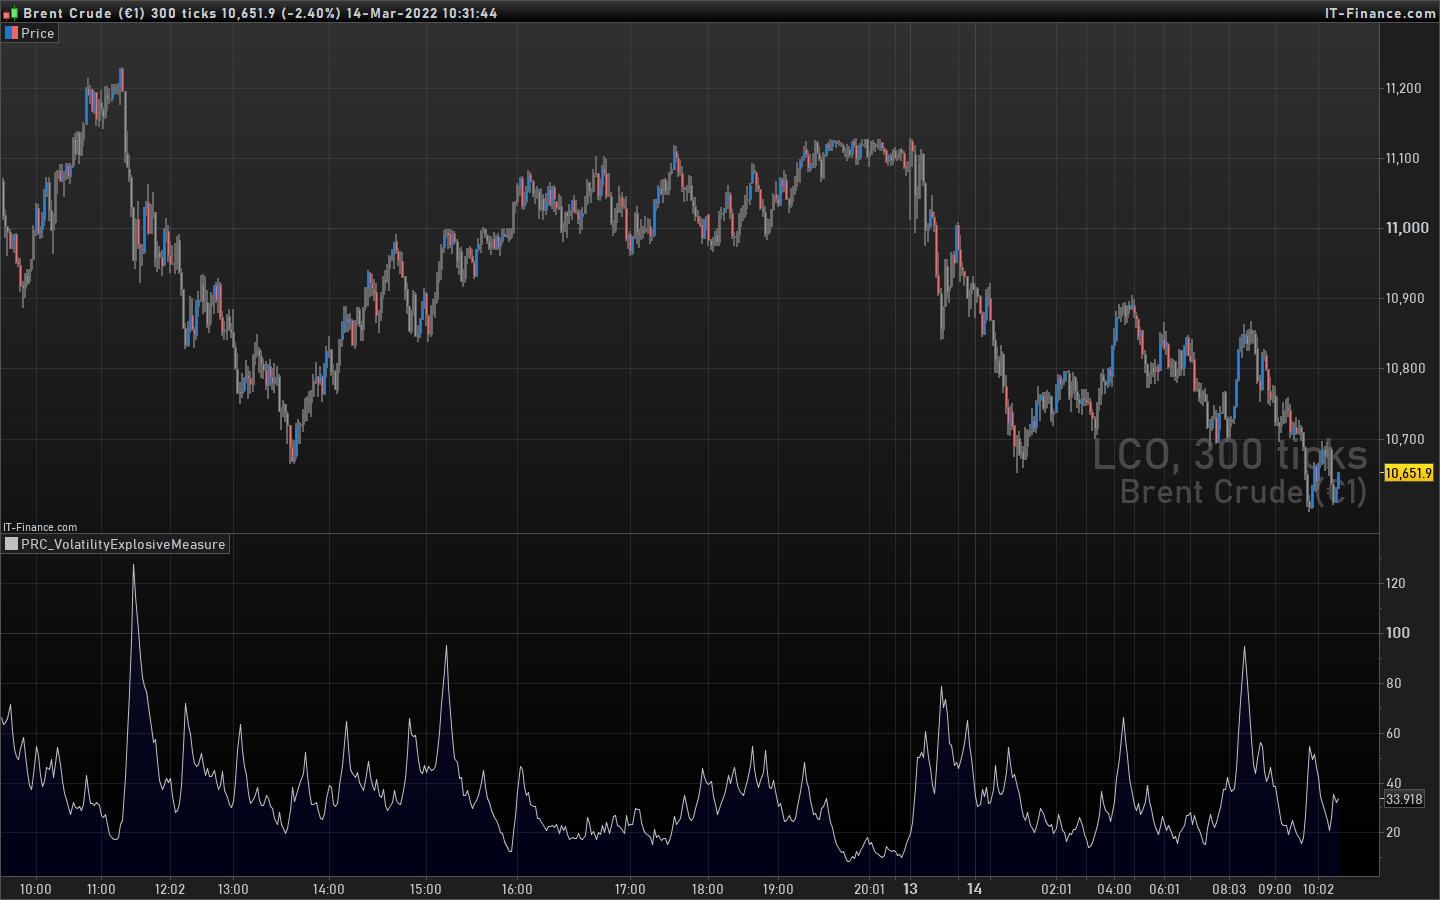
Measures the volatility range of current price range, can help detect squeezes as well explosive moves (description from original author: ricardo santos)
//PRC_VolatilityExplosiveMeasure | indicator
//14.03.2022
//Nicolas @ www.prorealcode.com
//Sharing ProRealTime knowledge
//converted from pinescript

bulloutput = 0
bearoutput = 0
irange = close - open
doji = irange = 0
upbar = irange > 0 or doji and irange[1] > 0
bullcounter = barssince(not upbar)
if (upbar) then
for i = 0 to max(0, bullcounter - 1)
bulloutput = bulloutput + irange[i]
next
endif

dnbar = irange < 0 or doji and irange[1] < 0
bearcounter = barssince(not dnbar)
if (dnbar) then
for i = 0 to max(0, bearcounter - 1)
bearoutput = bearoutput + irange[i]
next
endif

length = 10
bullma = average[length,1](bulloutput)
bearma = average[length,1](bearoutput)
width = bullma - bearma

return width
Download
Filename:
PRC_VolatilityExplosiveMeasure.itf
Downloads:
214
Legend
I created ProRealCode because I believe in the power of shared knowledge. I spend my time coding new tools and helping members solve complex problems.
If you are stuck on a code or need a fresh perspective on a strategy, I am always willing to help. Welcome to the community!
Author’s Profile
Similar code
The RVM (Relative Volatility Measure)Indicators
Volatility scalper indicatorIndicators
Mark Whistler’s Wave PMIndicators
Volatility & AmplitudeIndicators
Relative Volatility Intelligent IndexIndicators



Loading...
Bonjour. Merci beaucoup ! J'ai installé l'indicateur sur PRT 11 mais pour des raisons qui m'échappent il trace l'indicateur à l'intérieur même du graphique du prix, sous celui ci et non dans un rectangle séparé sous le graphique du prix. Ca le rend du coup inutilisable puisque je ne peux que conserver le prix ou l'indicateur mais pas visionner les 2 en même temps. Pouvez-vous m'aider ?