

Volatility Cycle
December 2, 2016, 8:55 AM
Indicators
0 Comments
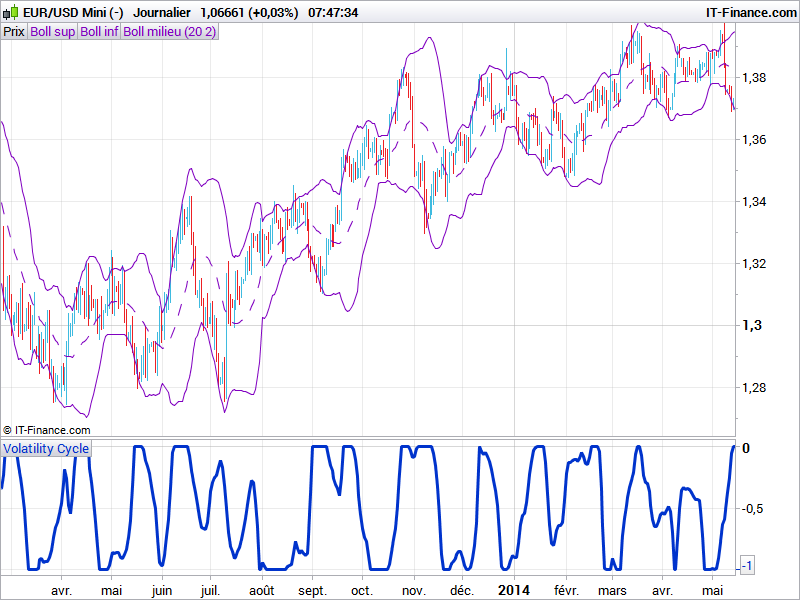
The volatility cycle indicator measure differences between current standard deviation of the price and its highest and lowest within the last “InpBandsPeriod” bars. It results of a bounded oscillator that can be read as:
- oscillator is low, expect a volatility explosion in the next periods or the end of the current trend
- oscillator is high, a trend is currently forming
The curve can be smooth much more to avoid false signals but with more lag.
This technical indicator should be used with other ones to confirm its information.
//PRC_Volatility Cycle | indicator
//02.12.2016
//Nicolas @ www.prorealcode.com
//Sharing ProRealTime knowledge
//converted and adapted from Metatrader4 version

InpBandsPeriod=18      // Period
Smooth=2               // Smoothness

StdDev = std[InpBandsPeriod](close)
highindex = highest[InpBandsPeriod](StdDev)[1]
lowindex = lowest[InpBandsPeriod](StdDev)[1]

if barindex>InpBandsPeriod then
VolDer = (StdDev-highindex)/(highindex-lowindex)
VolSmooth = average[Smooth](VolDer)

if VolSmooth>0 then
 VolSmooth = 0
elsif VolSmooth<-1.0 then
 VolSmooth = -1.0
endif

endif

RETURN VolSmooth as "Volatility Cycle"
Download
Filename:
PRC_Volatility-Cycle.itf
Downloads:
321
Legend
I created ProRealCode because I believe in the power of shared knowledge. I spend my time coding new tools and helping members solve complex problems.
If you are stuck on a code or need a fresh perspective on a strategy, I am always willing to help. Welcome to the community!
Author’s Profile
Loading...