

Vidya (Variable Index Dynamic Average).
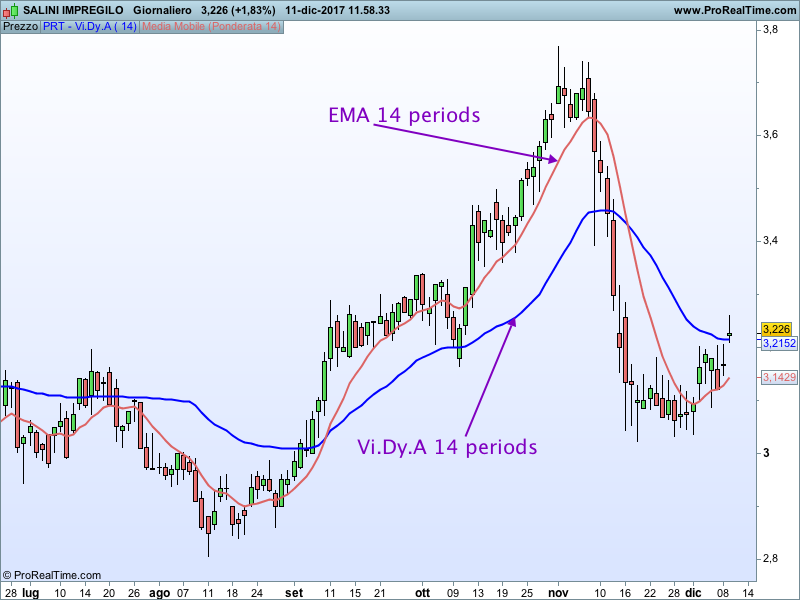
The Vidya indicator was developed in the 90’s by Tushar Chande who reformulated the exponential moving average. Chande’s indicator by its definition and construction reduces or eliminates the analyst’s discretionary decision process for the defining of the length of the moving average. The application of the indicator to historical time series has the effect of dramatically reducing false signals, relative to similar action, produced by the traditional moving averages, especially in trading range markets. The objective is to obtain a moving average capable of self-adjusting and varying its effective length relative to the current market “volatility”. Vidya is a dynamic indicator. It is essentially an exponential moving average that adapts its length to market “volatility”. Market “volatility” can be defined and measured as follows: by taking a momentum indicator (i.e. Relative Strength Index [RSI]xv or the absolute value of Chande Momentum Oscillator [CMO] xii ranging between 0 and 1), operating on the standard deviation of the closexii, or via the R2 (ranging between 0 and 1).
Blue skies!!
//Vi.Dy.A = (Variable Index Dynamic Average)

//period=14

if barindex>100 then
 //(Please note: the analyst can set α to be equal to any value, but the quantity (1-α*k) should always be positive).
 k=abs(Chandle[20](close))/100
 alfa=2/(period+1)
 vidya=(alfa*k*close+(1-alfa*k)*vidya[1])
endif

return vidya