

VAMA - Volatility Adaptive Moving Average
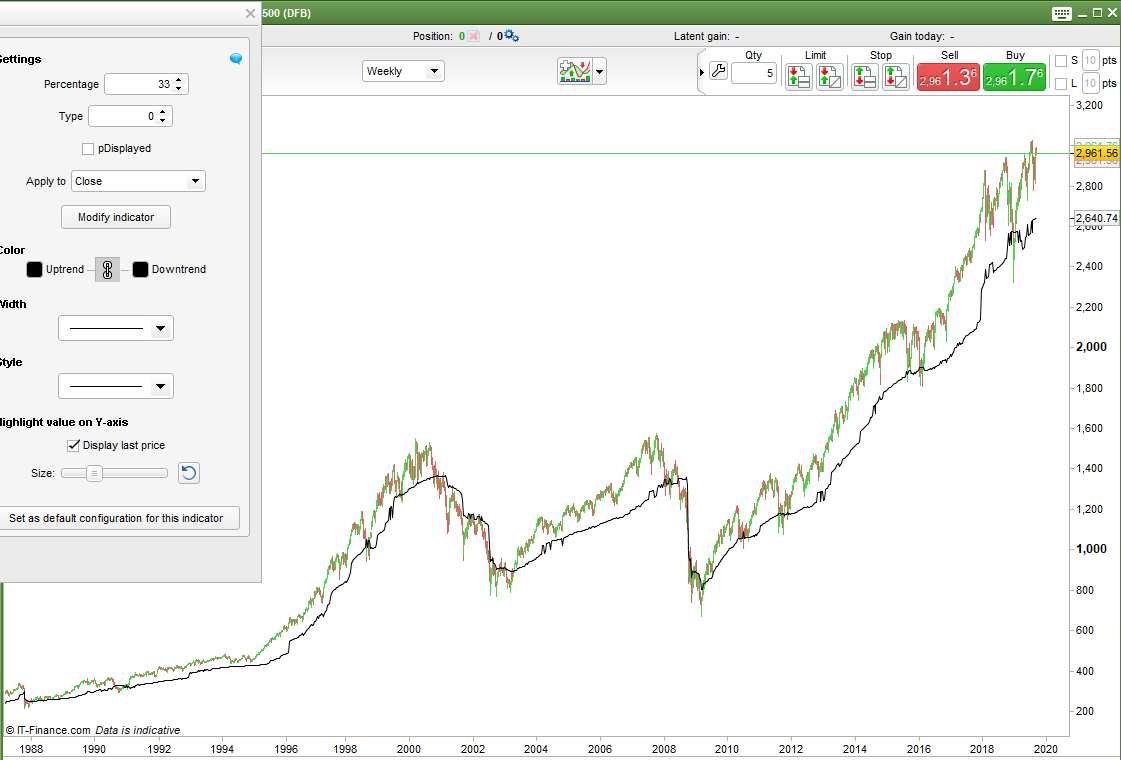
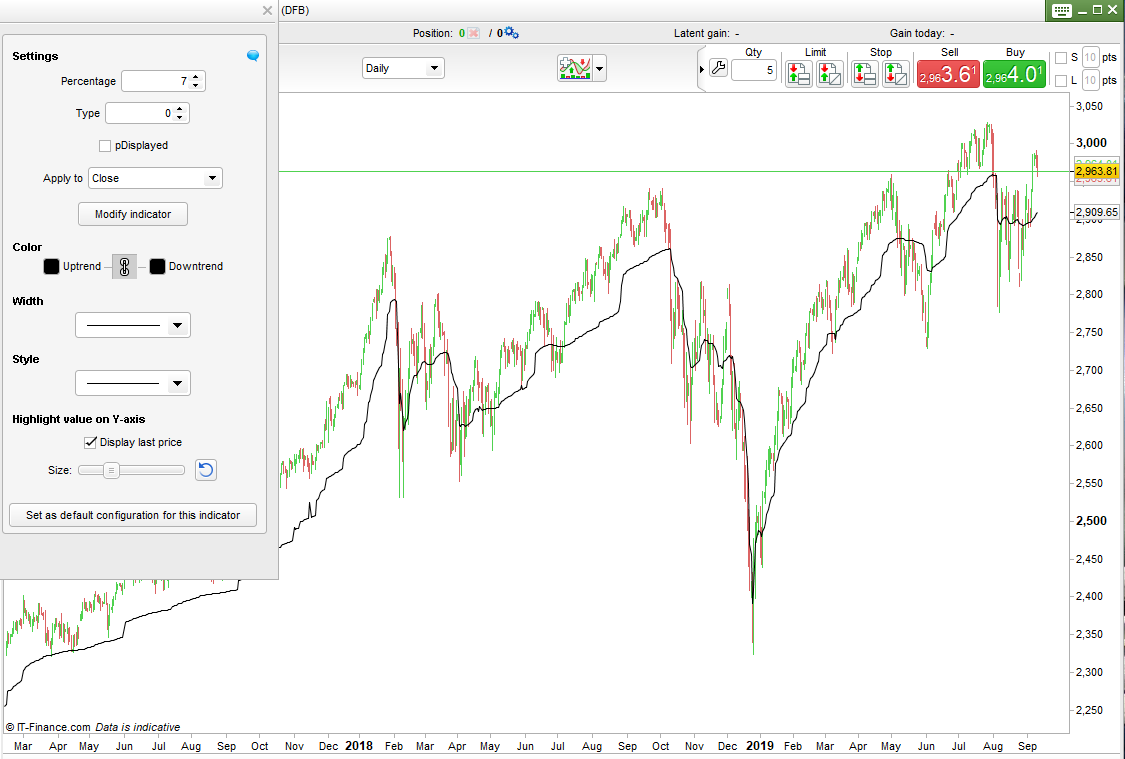
This VAMA indicator draws an average with a period of p. The value of p is changed depending upon recent market volatility.
You set a percentage and the indicator counts back how many bars are needed to find that the highest high minus the lowest low is greater or equal to the desired percentage of the current price. The value for p is the number of bars needed to find this range.
With this calculation when a market is not very volatile the value of p will be high and the average slower moving and in a volatile market the value of p will be low and the average faster moving.
You can change the average type drawn by changing the value of ‘type’ from 0 to 6.
- 0 = Simple
- 1 = Exponential
- 2 = Weighted
- 3 = Wilder
- 4 =Triangular
- 5 = End Point
- 6 = Time Series
Set ‘Percentage’ to whatever percentage of price you want to use to calculate the p value for the average.
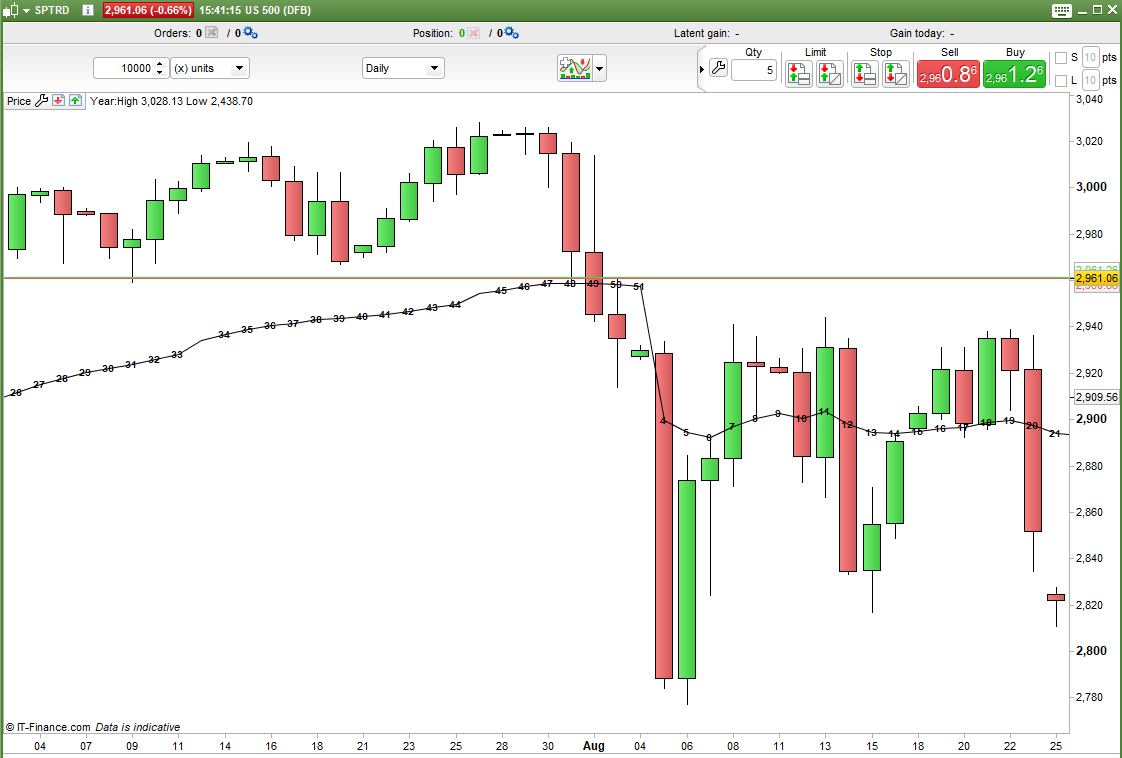
You can turn on and off the display of the latest p value change.
Due to the loop the average can be quite slow to draw so I advise using the DEFPARAM CALCULATEONLASTBARS to reduce calculation time.
I advise downloading the ITF file and importing it to get full functionality.
//VAMA - Volatility Adaptive Moving Average
//By Vonasi
//20190910

defparam calculateonlastbars = 1000
//percentage = 15 // percentage price move to calculate p on.
//type = 1 //average type

type = max(0,min(type,6))

if barindex >= 1 then
 hh = close
 ll = close
 p = 0
 for a = 0 to barindex
  hh = max(hh,high[a])
  ll = min(ll,low[a])
  if (hh - ll)/close >= (percentage/100) then
   p = a+1
   break
  endif
 next

 if p > 0 then
  vama = average[p,type](customclose)
 endif
endif

if pDisplayed then
 if p <> p[1] then
  drawtext("#p#", barindex, vama ,SansSerif,Bold,10) COLOURED(0,0,0)
 endif
endif

return vama