

V11 dynamic rectangle from moving average breakout zone to any future bar
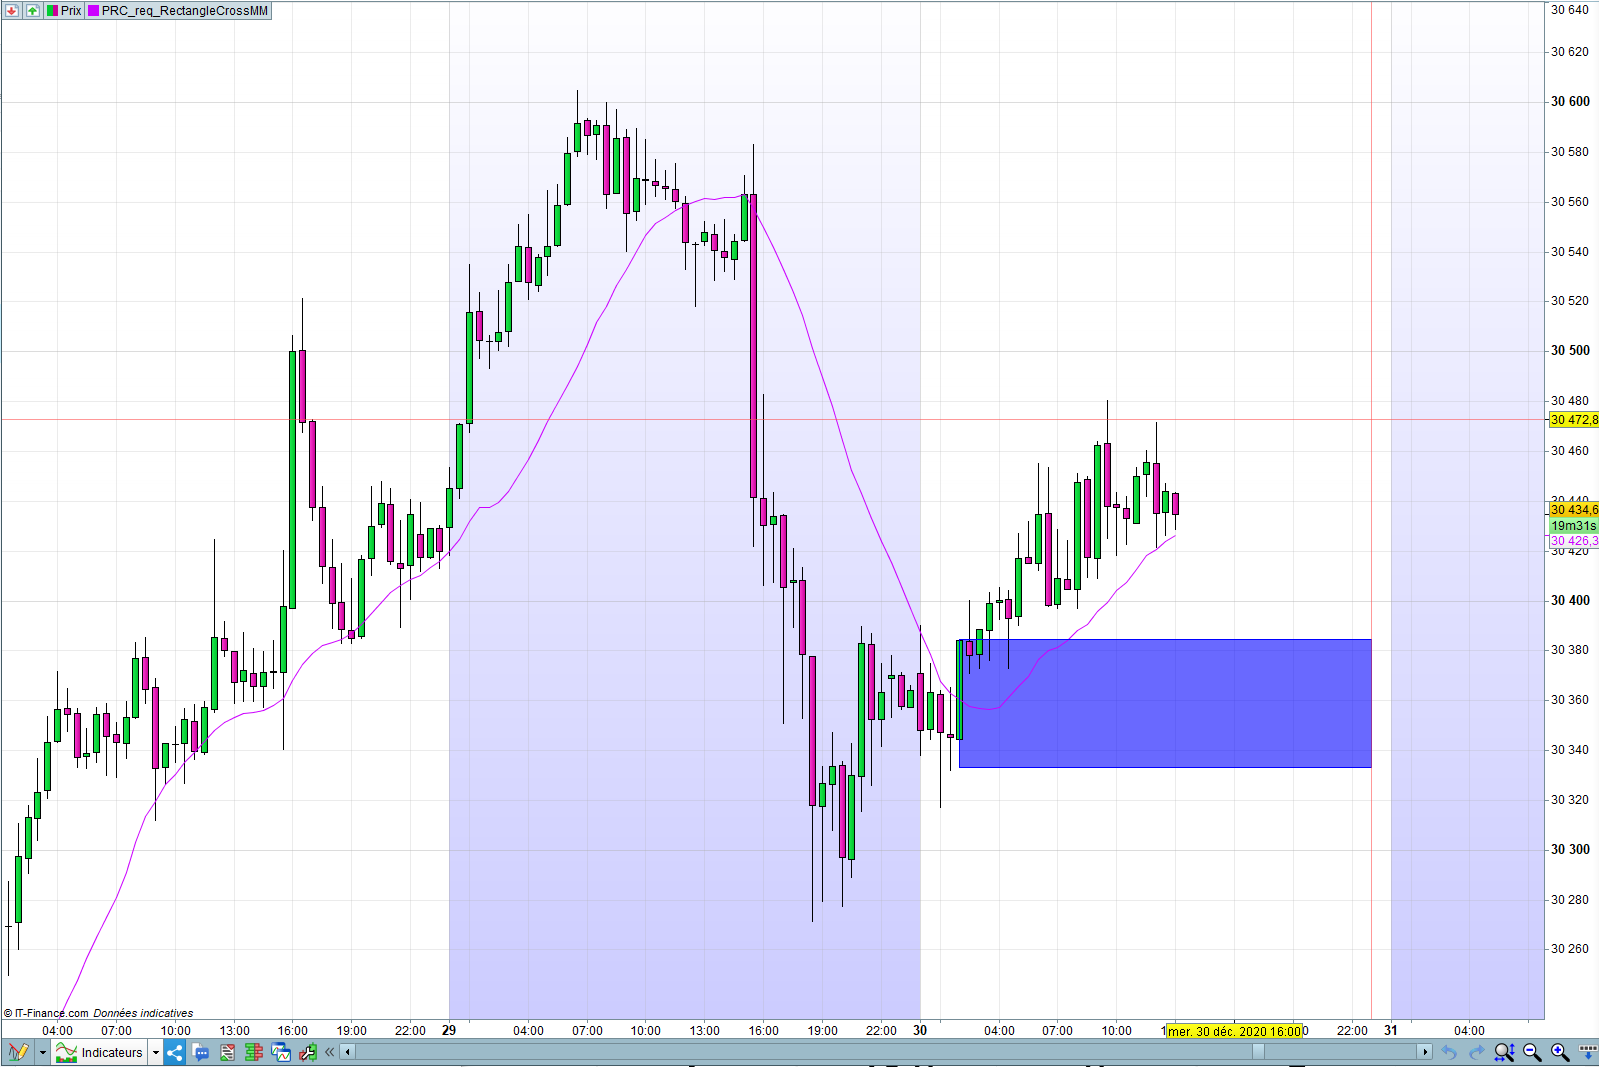
A request was made in the Probuilder forum, to display a rectangle starting from the price crossing a moving average 20 and continuing to the right of the price thanks to v11 new capability, with same height as breakout candle, and only showing the latest active occurrence.
https://www.prorealcode.com/topic/continuer-dessin-vers-la-droite/
Use N as how many bars to the right of the latest price you want to extend the rectangle to.
Use period to customise the moving average
It is not much to look at in terms of graphic output, but if you recently had an update to PRT v11, it shows you the simplest way to code a self-refreshing drawing in the present triggered by a single event in the past and still able to extend in a constant way in the future no matter how long ago the triggering event was.
Therefore you can use the concept and easily adapt the code with something else than a moving average to suit many other needs you may have to highlight anything.
// PRC MM20 break rectangle
// 21.12.2020 mod 30.12.2020
// Noobywan @ www.prorealcode.com
// Sharing ProRealTime Knowledge
// Forum ProBuilder user Remy92400 request

defparam DRAWONLASTBARONLY=true

N=15 //or set as external parameter
period=20 //or set as external parameter

mm=Average[period](close)

if (close crosses over mm or close crosses under mm) then
   barre=barindex
   haut=high
   bas=low
endif

DRAWRECTANGLE(barre, bas, barindex+N, haut) coloured (0,0,255,150) bordercolor(0,0,255)

return mm