

Uhl MA Crossover System
This indicator is a ProRealTime port of the Uhl MA Crossover System, originally developed by Andreas Uhl. It replaces the classical moving average crossover approach with two adaptive lines that both use the same underlying principle: how much does the current price or smoothed price deviate from where the adaptive line currently sits, compared to how much variance exists in the price series over the lookback period. That variance comparison is what drives the adaptation.
The variance is computed from scratch on each bar using a single-pass algorithm that calculates the population variance of the last N closes without storing the entire price series. This is then used as a benchmark. If the squared distance between price and the adaptive line is larger than the variance, the line moves slowly and stays where it is, anchored against noise. If the distance is smaller than the variance, the coefficient drops to zero and the line barely moves at all. The result is a line that only commits to following price when there is a statistically meaningful reason to do so.
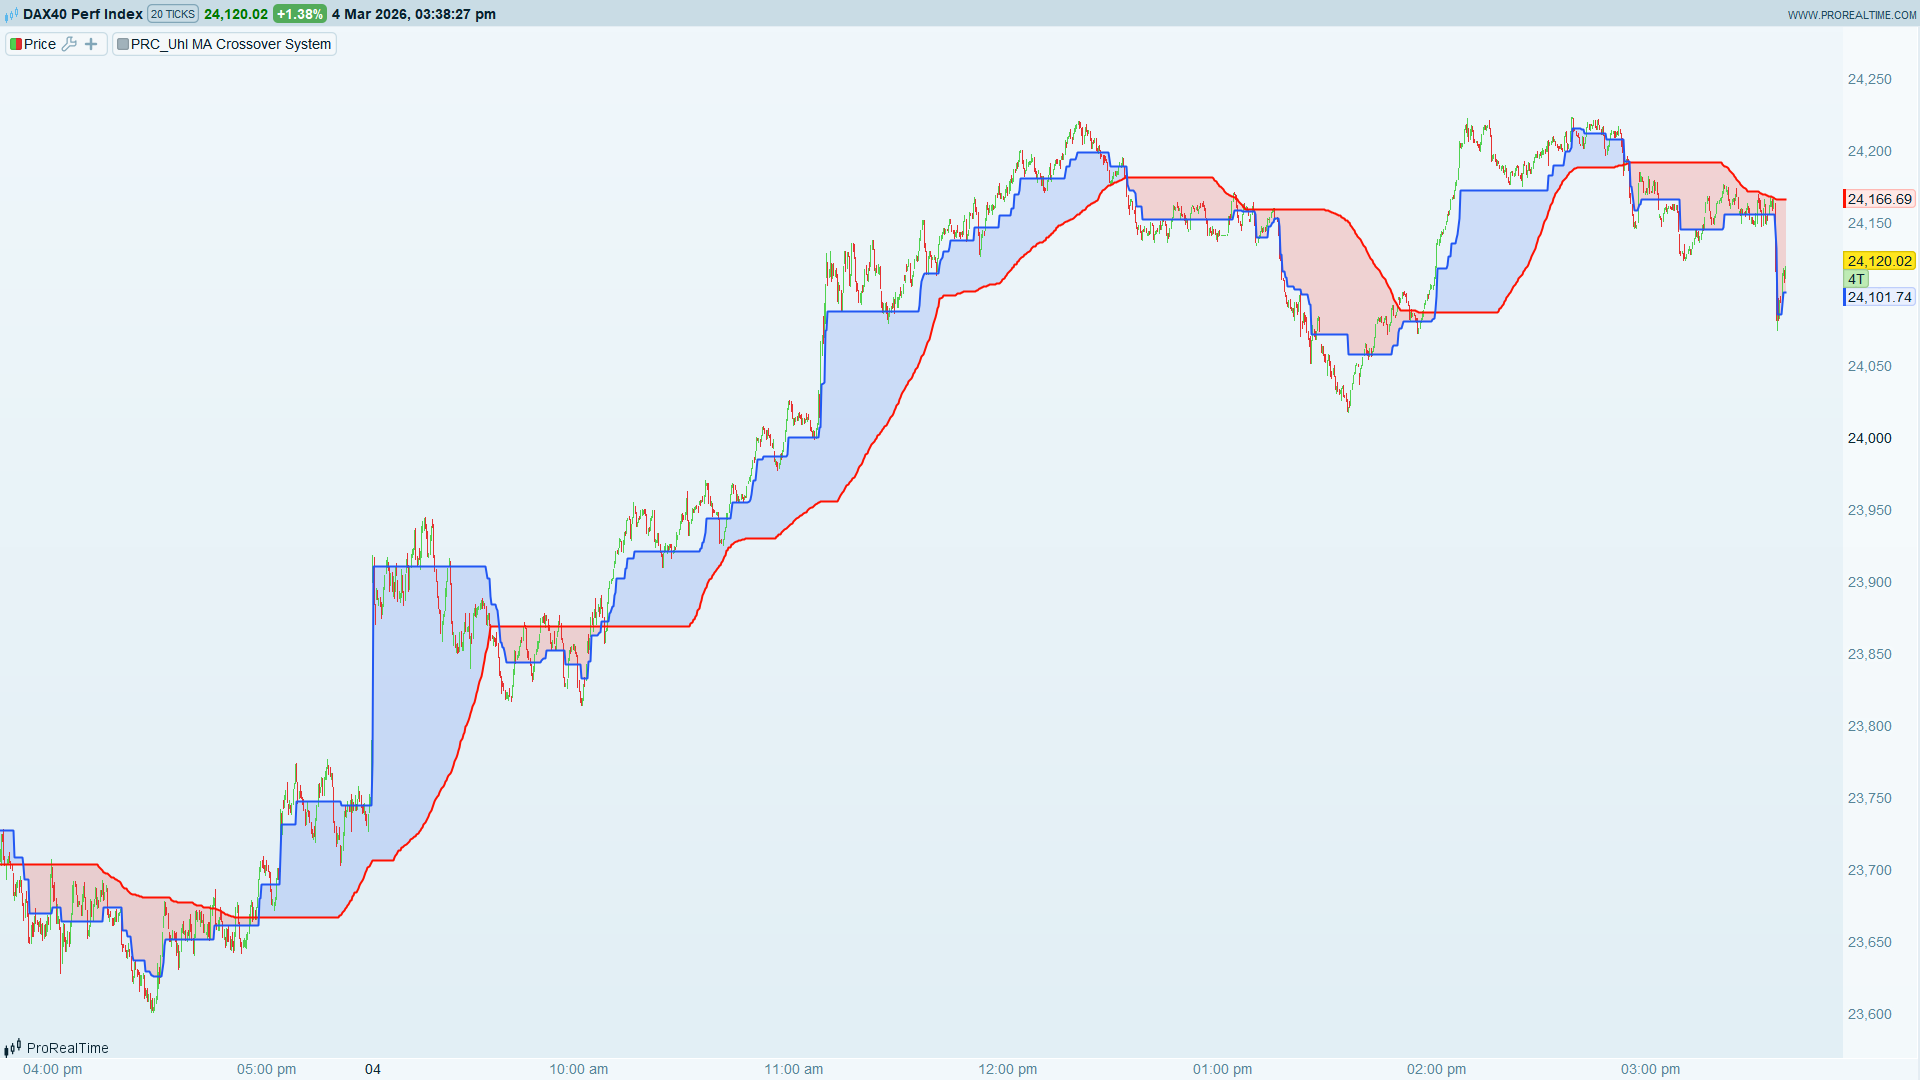
Two lines are produced from this logic. The first, CMA, tracks the SMA of price using the variance-gated coefficient. It represents the smoothed trend reference. The second, CTS, tracks raw price directly using the same gating mechanism. It is more reactive because it is benchmarking instantaneous price against the variance rather than a smoothed version of it. The crossover between these two lines is the signal: CTS crossing above CMA suggests upward momentum is building, CTS crossing below CMA suggests the opposite.
The area between the two lines is filled with a semi-transparent color, blue when CTS is above CMA and red when below. This makes the current bias immediately visible without having to read individual line positions.
What makes this different from a standard dual-MA crossover is that both lines slow down and become sticky during low-momentum or noisy conditions. They do not keep grinding toward price at a fixed rate the way an EMA or SMA does. During genuine trends, the gap between the two lines tends to be clean and persistent. During chop, both lines converge and the crossovers become less frequent because neither line wants to move much.
Parameters
- Length: the lookback period used for both the variance calculation and the SMA. Default 100. Shorter values (20 to 50) make both lines more reactive and produce more frequent signals. Longer values (100 to 200) focus on larger structural trends and filter out shorter-term noise.
- Mult: available as a scaling parameter if you want to modulate how aggressively the variance gate responds. At 1.0 the behavior matches the original specification.
Suggested usage
Works best on trending instruments and larger timeframes where the variance gating has room to do its job. On daily or weekly charts of indices, commodities, or trending forex pairs, the two-line fill gives a clear visual picture of trend phases. Because both lines are slow to react to noise, this system tends to stay in trends longer than a conventional MA crossover but also takes longer to confirm reversals, so it is worth combining with a shorter-term momentum filter if you need earlier entries.
// -------------------------------------------------------
// PRC_Uhl MA Crossover System - ProRealTime / ProBuilder version
// Original concept by alexgrover
// Ported to ProRealTime by Nicolas - ProRealCode
// www.prorealcode.com
// -------------------------------------------------------

// Inputs
Length = 100
Mult = 1.0

Src = close

// Calculation of Variance, Simple Moving Average (SMA)
once mperiod=length

m=0
s=0
oldm=0
for k=0 to mperiod-1 do

   oldm = m
   m    = m+(src[k]-m)/(1.0+k)
   s    = s+(src[k]-m)*(src[k]-oldm)
next

Var = (s/(mperiod-1))
SMA = Average[Length](Src)

// Custom moving averages initialization
cma = 0
cts = 0

// Calculation of custom moving averages
IF BarIndex > Length THEN
   secma = square(SMA - cma[1])
   sects = square(Src - cts[1])
   if Var < secma then
      ka = 1 - Var/secma
   else
      ka=0
   endif
   if Var < sects then
      kb = 1 - Var/sects
   else
      kb=0
   endif
   cma = ka * SMA + (1 - ka) * cma[1]
   cts = kb * Src + (1 - kb) * cts[1]

   if cts>cma then
      r=33
      g=87
      b=243
   else
      r=255
      g=17
      b=0
   endif
   colorbetween(cma,cts,r,g,b,40)
ENDIF

return cma coloured(255,17,0) style(line,2), cts coloured(33,87,243) style(line,2)