

TTM Squeeze Oscillator and On price version
The TTM Squeeze Oscillator (by John Carter) measure the strength of the market and its momentum. It is built with the Bollinger and the Keltner bands. When the volatility increase, the Bollinger Bands are widening and are enveloping the Keltner channel, while when the market is consolidating the BB are inside the KC and the market is squeezing.
Squeeze on: Red dots appears on the oscillator, prepare for a consolidation breakout to come.
Market is trending, squeeze is off: Green dots
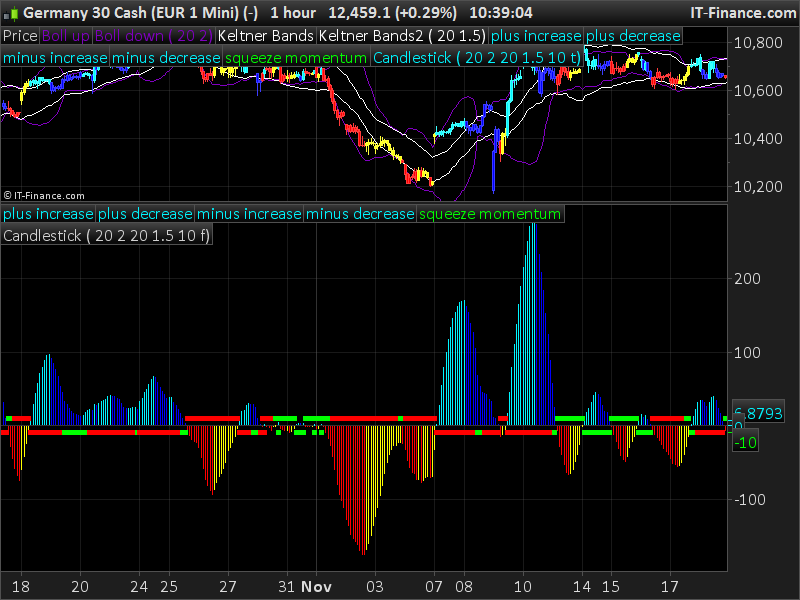
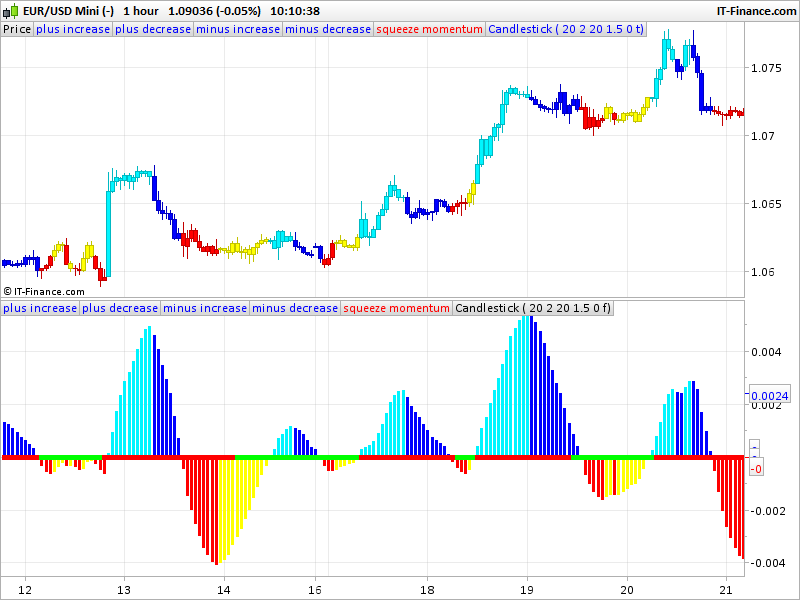
The trend momentum and direction is identifiable with the oscillator color:
- light blue = trend is up ; dark blue = momentum of bullish trend is decreasing.
- red = trend is down ; yellow = bearish momentum is decreasing.
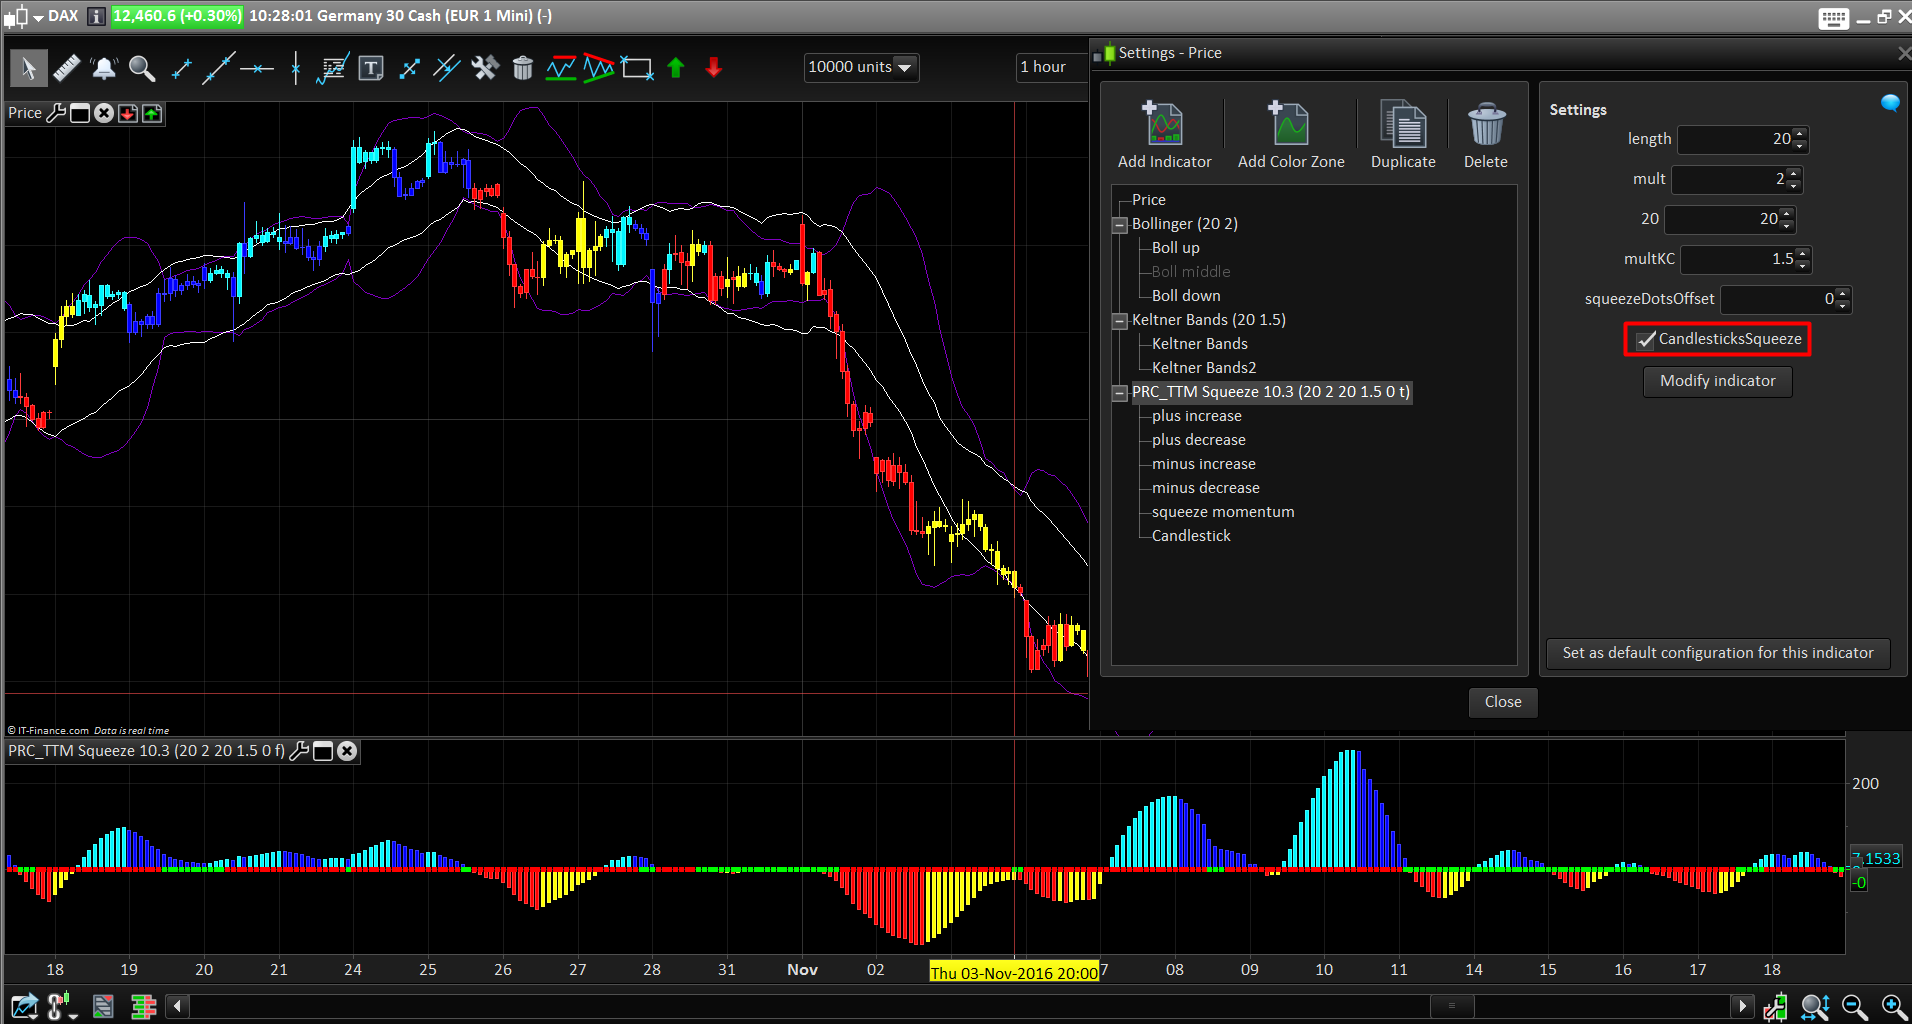
In this version, I added the possibility to apply the indicator on the price also to color the candlesticks accordingly to the squeeze oscillator. So this indicator embed 2 indicators at once: the oscillator and the candlesticks painter. To get the coloured candlesticks, apply the indicator on the price and tick the “CandlesticksSqueeze” in the indicator settings.
The “squeezeDotsOffset” setting help you move the oscillator dots above/below the zero level of the oscillator. I found that sometime, the color overlay of the histogram and the dots were disturbing, so this offset can resolve this “problem”.
//PRC_TTM Squeeze for PRT v10.3| indicator
//27.04.2017
//Nicolas @ www.prorealcode.com
//Sharing ProRealTime knowledge

//---Settings
//length=20
//mult=2
//lengthKC=20
//multKC=1.5
//squeezeDotsOffset=0
//candlesticksSqueeze=0 //boolean variable
//---End of settings

//BB
basis = average[length](close)
dev = mult * Std[length](close)
upperBB = basis + dev
lowerBB = basis - dev

//KC
ma = average[lengthKC](close)
myrange = range[lengthKC]
rangema = average[lengthKC](myrange)
upperKC = ma+rangema * multKC
lowerKC = ma-rangema * multKC

value = (Highest[lengthKC](high)+Lowest[lengthKC](low)+average[lengthKC](close))/3
val = linearregression[lengthKC](close-value)

sqzOn = (lowerBB>lowerKC) AND (upperBB<upperKC)

if(sqzOn=1) then
 scolorR = 0
 scolorG = 255
else
 scolorR = 255
 scolorG = 0
ENDIF

if val>0 then
 sqz=-squeezeDotsOffset*pointsize
else
 sqz=squeezeDotsOffset*pointsize
endif

//histogram modifications
if val>0 and val>val[1] then
 plusI = val
 plusD = 0
 minusI = 0
 minusD = 0
 colorR=0
 colorG=245
 colorB=255
elsif val>0 and val<val[1] then
 plusI = 0
 plusD = val
 minusI = 0
 minusD = 0
 colorR=0
 colorG=0
 colorB=255
elsif val<0 and val<val[1] then
 plusI = 0
 plusD = 0
 minusI = 0
 minusD = val
 colorR=255
 colorG=0
 colorB=0
elsif val<0 and val>val[1] then
 plusI = 0
 plusD = 0
 minusI = val
 minusD = 0
 colorR=255
 colorG=255
 colorB=0
endif

//candlesticks squeeze painting
if CandlesticksSqueeze then
 drawcandle(open,high,low,close) coloured(colorR,colorG,colorB)
endif

RETURN plusI coloured(colorR,colorG,colorB) style(histogram,1) as "plus increase", plusD coloured(colorR,colorG,colorB) style(histogram,1) as "plus decrease", minusI coloured(colorR,colorG,colorB) style(histogram,1) as "minus increase", minusD coloured(colorR,colorG,colorB) style(histogram,1) as "minus decrease", sqz coloured(scolorR,scolorG,0) style(point,5) as "squeeze momentum"