TTI RSIV-1 indicator

v10.3
TTI RSIV-1 indicator

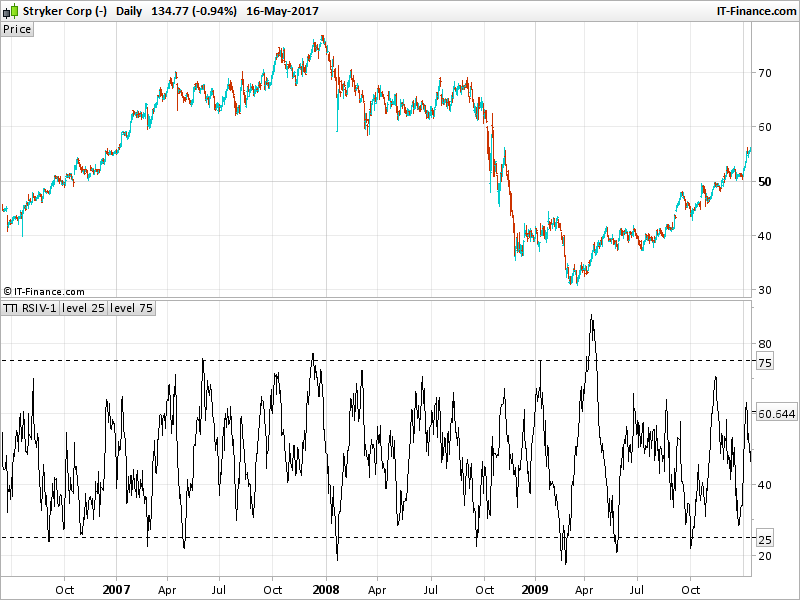
The classic Relative Strength Indicator as created by J. Welles Wilder Jr. is based on sound logic, and was a groundbreaking technical tool in its day. When it was introduced in 1978, computational hardware was not widespread, and it is thus reflective of that limitation. In those days, the trader could not just flip the computer on switch and crank out a hundred million operations per second whenever she felt like it. The original RSI is calculated with an exponential moving average of the increases and decreases for updays and downdays, respectively. The TTI RSIV-1 version computes a simple product of the two, using multiplication. The process of multiplication emphasizes larger movements more decidedly, thus magnifying volatility. It is because of this change that the threshold triggers should to be changed to 25 and 75.

The RSIV-1 is able to adapt quickly to the change in trading direction and thus give back-to-back long and short signals. The primary reason that RSIV-1 can adapt quickly is due to the nature of the linear regression it uses. Linear regression can adapt to direction changes relatively fast.

Description from author of the indicator: Kirk Northington


Indicator translated from TradeStation programming language by a request on the Italian forum.


Share this

Risk disclosure:

No information on this site is investment advice or a solicitation to buy or sell any financial instrument. Past performance is not indicative of future results. Trading may expose you to risk of loss greater than your deposits and is only suitable for experienced investors who have sufficient financial means to bear such risk.

ProRealTime ITF files and other attachments : How to import ITF files into ProRealTime platform?

PRC is also on YouTube, subscribe to our channel for exclusive content and tutorials

avatar
Register or

Likes

avatar avatar avatar avatar avatar avatar avatar
Related users ' posts
supertiti hola Ivan Eso quiere decir que el Parabolic sar RSI est igual al parabolic sar de PRT ? p...
supertiti buenas tardes Ivan me gusteria tener lo mismo on chart con los puntos azules y rosas de c...
LucasBest Thanks for the translation. This one can be compared to dynamic zone RSI
Iván
1 month ago
luxrun grazie Ivàn!
lee Thank you. Is it possible to convert this to a screener that displays instruments when bulli...
Iván //---------------------------------------------------------------// //PRC_Pollan Indicator /...
Faisalx ChatGPT Hola Iván. Gracias por tu excelente trabajo. Te agradecería si pudieras echarle un...
Iván ok, perfecto! me pongo con ello
Iván Hi, Sorry, but what do you mean?
luiskohnen Hola, queria saber si el indicador repinta, porque a mi me parecio que si. Saludos y gracias...
Diamant Bonsoir, L'un d'entre vous peut-il me donner les définissions de LL-HH-LH et HL. Merci d'av...
Bernard13 (Je réécris mon commentaire -français- en français car certains mots ne correspondaient pas ...
Iván 1000 indicateurs !!! brutaux
Iván Gracias! Para el screener sólo tienes que copiar el indicador y poner como condición de búsq...
Lean Muchas gracias Iván, ya lo he podido crear.
bertoluce Hello Ivan, thank you very much for the indicator. An observation: would it be possible (and...
Iván sería así //------------------Inputs------------------------------ linreglength = 11//i...
Doddge Muchísimas gracias Iván, está genial.
superfalcio holaaa, have you run some statistics?
Msport71 Thank You very much
Bateson
2 years ago
Matriciel Very nice job ! Is it possible to do the opposite because what interests me is to have the ...
YvesRobert Hi Matriciel, how can we do this, because stochastic is limited between 0 and 100 but price ...
Traderfox06 Dear zeiiermantrading, I really like your approach combining adaptive averages with MACD in...

Top