

TTI ATR Extreme
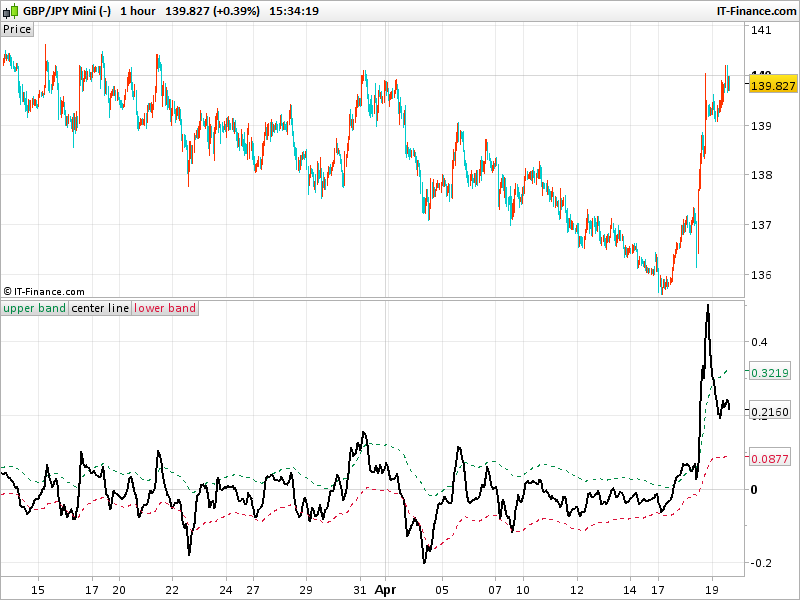
Another new channel indicator made of price differences (high or low) from a moving average (40 periods EMA) and ponderate by the recent average true range (14 periods).
The result of this calculation is then smoothed by another Exponential Moving Average of 3 periods. This is the “center” of the band. The upper and lower bands are calculated with the standard deviation 200 periods from this center value (smoothed with another 40 EMA beforehand).
The indicator act as an oscillator with dynamic overbought and oversold areas, that could be used as potential reversal zones or breakout ones to trade in the same direction.
This code come from a Kirk Northington’s book.
Coded by a request on the Italian forum, translated from a Metastock formula.
//PRC_TTI ATR Extreme | indicator
//19.04.2017
//Nicolas @ www.prorealcode.com
//Sharing ProRealTime knowledge

atr=(averagetruerange[14]/Close)
if close<exponentialaverage[40] then
 x = (((Low - average[40,1](low))/Close)*100)*(ATR*100)
else
 x = (((High - average[40,1](high))/Close)*100)*(ATR*100)
endif

avg = average[40,1](x)
dev = std[200](x)

upperband = avg+dev
center = average[3](x)
lowerband = avg-dev

return upperband coloured(0,139,69) style(dottedline,1) as "upper band", center style(line,2) as "center line", lowerband coloured(220,20,60) style(dottedline,1) as "lower band"