







TSR ADR Daily Range Display
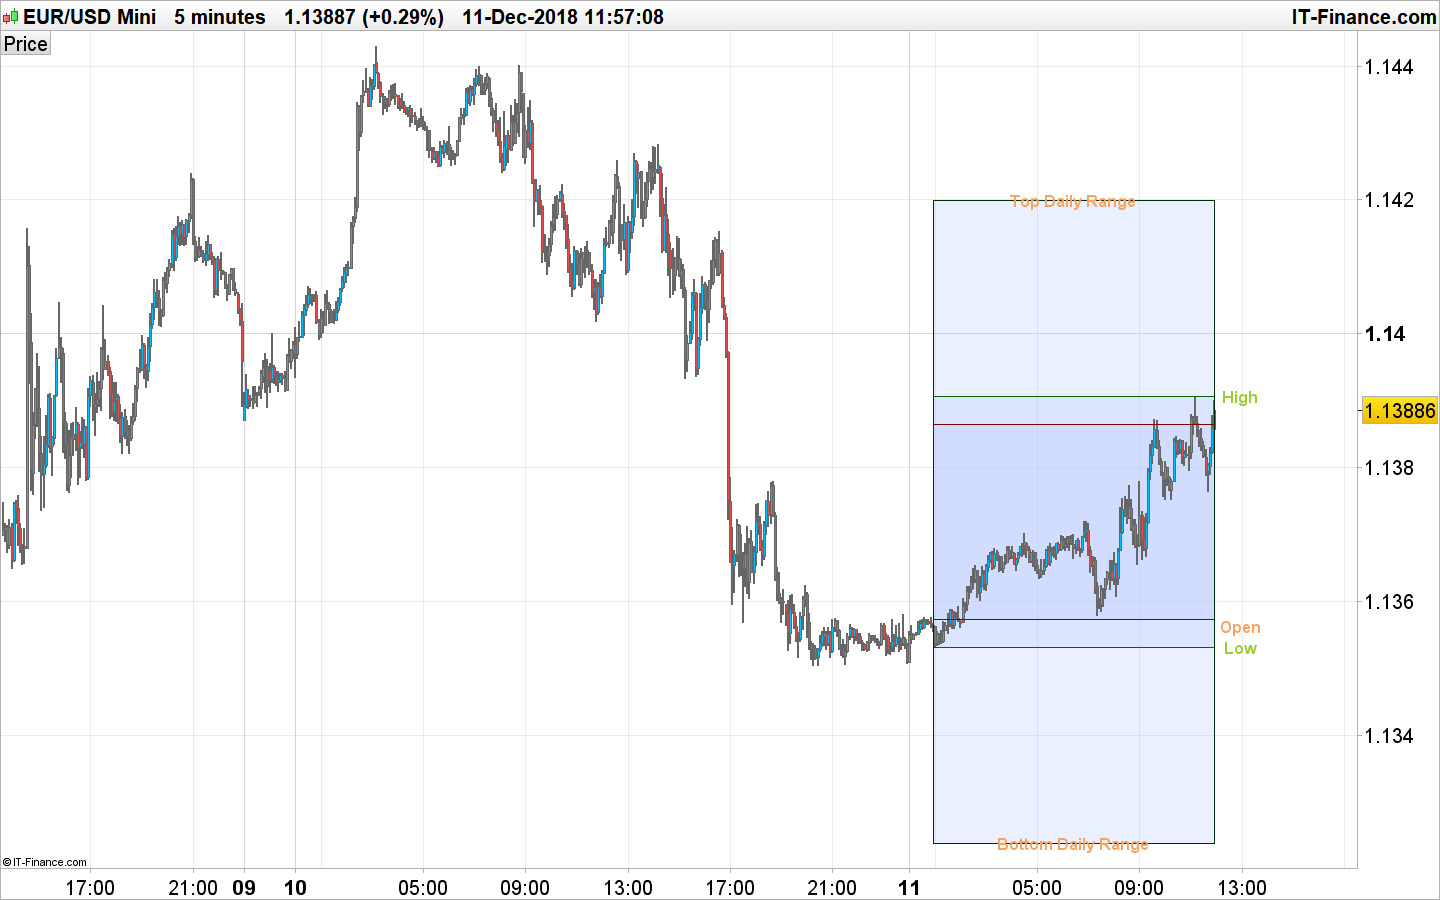
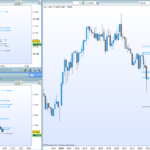
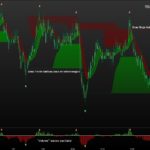
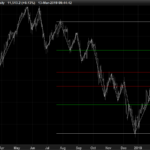
This indicator plot rectangle of Average Day Range of different periods and therefore how far the market travels on average.
So the marked levels could be used as support / resistance levels or objectives.
The indicator uses 20 day average.
Converted from a MT4 indicator as requested in the ProBuilder english forum.
//PRC_TSR_DailyRange_display | indicator
//11.12.2018
//Nicolas @ www.prorealcode.com
//Sharing ProRealTime knowledge
//translated from MT4 version

defparam drawonlastbaronly=true

if day<>day[1] then
 startbar=barindex
 FIVE=0
 TEN=0
 TWENTY=0
 for i = 1 to 20 do
  if i<6 then
   FIVE=FIVE+(dhigh(i)-dlow(i))
  endif
  if i<11 then
   TEN=TEN+(dhigh(i)-dlow(i))
  endif
  TWENTY=TWENTY+(dhigh(i)-dlow(i))
 next
 FIVE = FIVE/10
 TEN = TEN/20
 TWENTY = TWENTY/40
 AV = (FIVE+TEN+TWENTY)/3
endif

HIDaily = dhigh(0)-(AV)
LOWDaily = dlow(0)+(AV)
HIDaily1 = dhigh(0)
LOWDaily1 =dlow(0)
HIDaily2 = dhigh(0)-(AV)*2
LOWDaily2 =dlow(0)+(AV)*2

drawrectangle(startbar,HiDaily,barindex,LOWDaily) coloured(128,0,0)
drawrectangle(startbar,HiDaily1,barindex,LOWDaily1) coloured(0,100,0)
drawrectangle(startbar,HiDaily2,barindex,LOWDaily2) coloured(0,44,9)
center=max(startbar+(barindex-startbar)/2,1)
drawtext("Top Daily Range",center,LowDaily2,Dialog,Bold,16) coloured(244,164,96)
drawtext("Bottom Daily Range",center,HiDaily2,Dialog,Bold,16) coloured(244,164,96)
drawtext("             High",barindex,dhigh(0),Dialog,Bold,16) coloured(154,205,50)
drawtext("             Low",barindex,dlow(0),Dialog,Bold,16) coloured(154,205,50)
drawtext("             Open",barindex,dopen(0),Dialog,Bold,16) coloured(244,164,96)
RETURN
Comments
You must be logged in to post a comment.


je constate que de plus en + de trader utilise des zones de prix pour leur positions. elles sont déterminées par un tracés de lignes des plus haut et plus bas sur 3 unités de temps par exemple. cela créé une zone d achat et une zone de vente. un tel inducteur existe t il d après vous ? Cordialement.

hello Nicolas, can I change the indicator that I only get the time of 8-9 clock displayed? and it can also change that

Non saprei, che ne dici di provare?
Ciao Nicolas, ottimo indicatore, sarebbe possibile creare un trading system su questo indicatore, che acquisti quando il prezzo tocchi la linea "bottom" e venda quando il prezzo tocchi la linea "top"?
This seems like a very useful indicator. However, it does not seem to open properly in the current version of PRT?