

Triple Function Indicator
February 5, 2020, 10:19 AM
Indicators
10 Comments
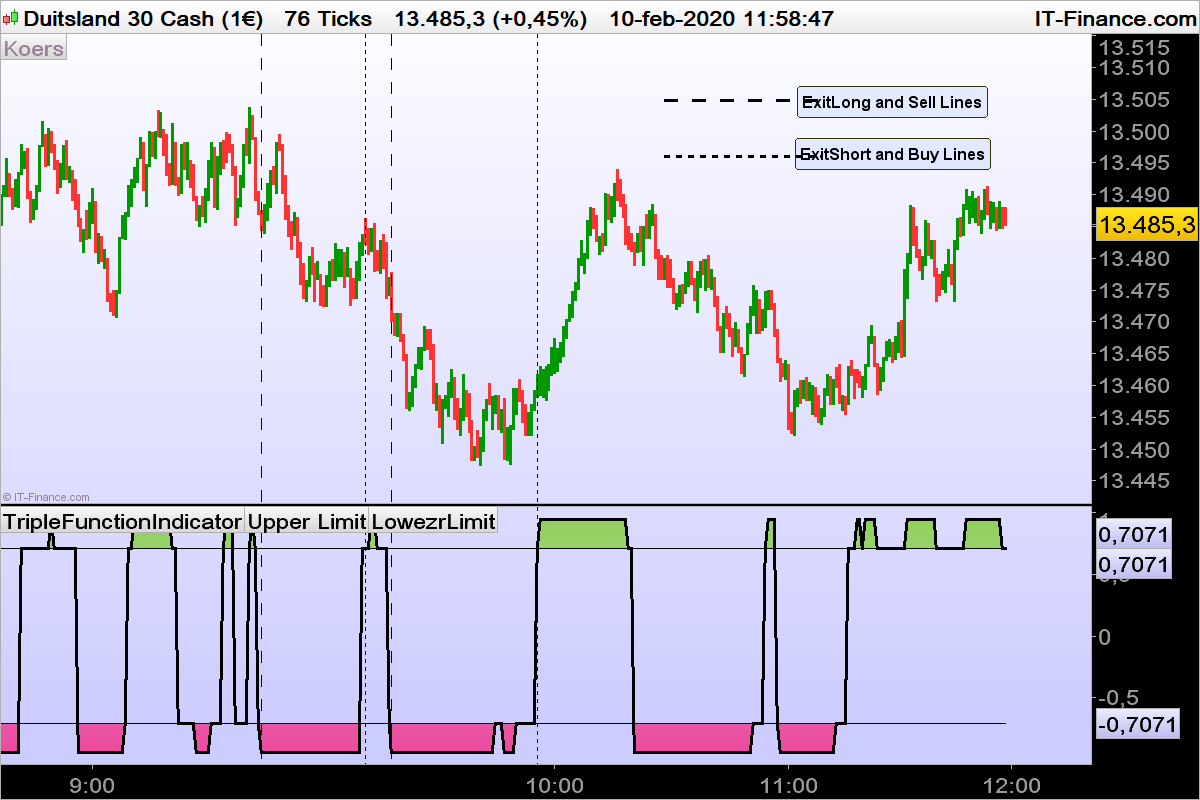
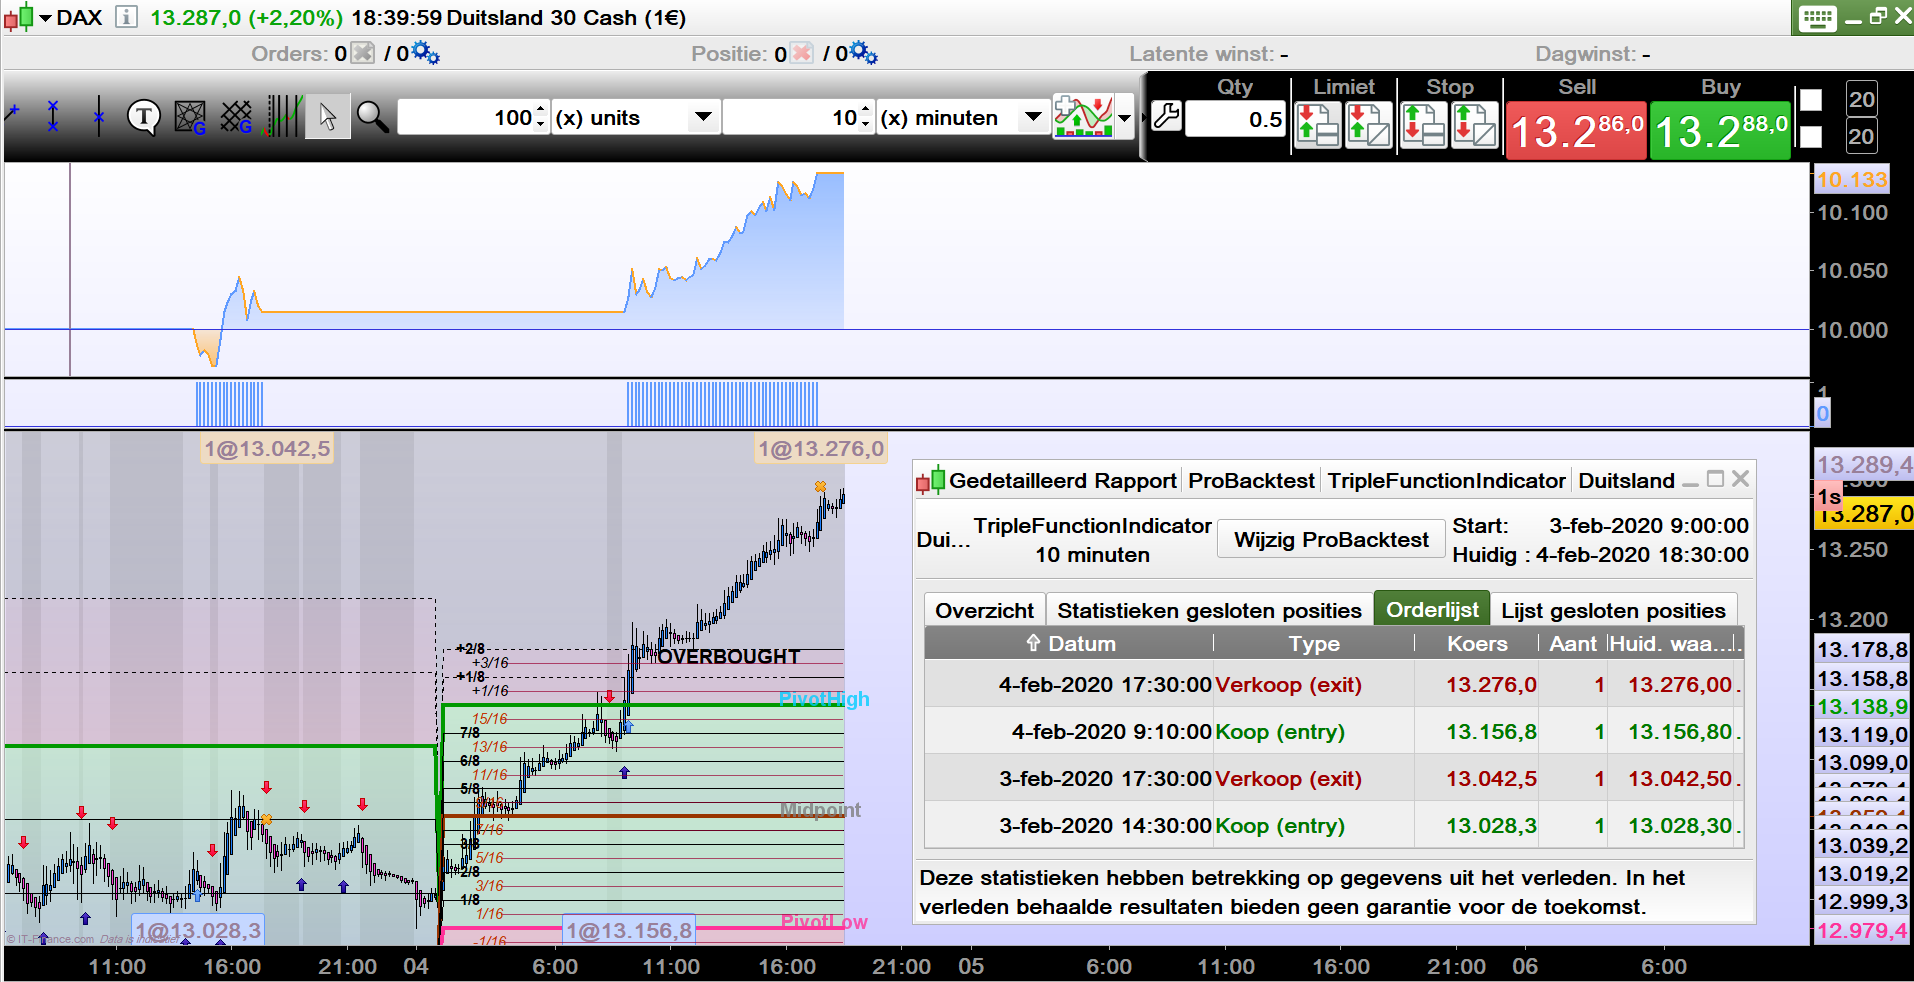
TripleFunctionIndicator (TFI) is meant to be a daytrading system that give good results on a 10 minutes graphic. Especially its a combination of three 3 Indicators namely the SMI The CCI and the RSI indicator. As you can see on the graphic,, even on an overbought situation, given by DemarkIndicator it do work. The classic limits for each indicator are repected.
For SMI +40 and -40
For CCI +100 and -100
For RSI 70 and 30.
Finally each Indicator give 3 results if there is a condition fullfilled or not and none of the two.
The total result is calculated and as only 3 possibilities namely +3 ;+1 ; -1 and -3.
// Parameters for the StochasticMomentumIndicator
n=17
m=5
c1=SMI[14,3,5](close)>40
c11=SMI[14,3,5](close)>-40

// Parameters for the CommodityChannelIndex

c2= CCI[n](typicalPrice)>100
c21=CCI[n](typicalPrice)<-100

//Parameters for the Relative StrenghtIndex

c3=RSI[m](close)>70
c31=RSI[m](close)<30

//Test for each Indicator

if c1 then
ZLS1= 1
elsif c11 then
ZLS1=-1
endif

if c2 then
ZLS2=1
elsif c21 then
ZLS2=-1
endif

If c3 then
ZLS3=1
elsif c31 then
ZLS3=-1
endif

//Summary of the results

TFI = sin(atan(ZLS1+ZLS2+ZLS3))

return TFI as"TripleFunctionIndicator", sin(atan(1)) as"Upper Limit", sin(atan(-1)) as"LowezrLimit"
Download
Filename:
TripleFunctionIndicator.itf
Downloads:
676
Download
Filename:
backtest-dax-min-15808380998cpl4.png
Downloads:
275
Master
As an architect of digital worlds, my own description remains a mystery. Think of me as an undeclared variable, existing somewhere in the code.
Author’s Profile
Loading...