

Triangular MA StairStep with percent variation
October 21, 2015, 8:39 PM
Indicators
0 Comments
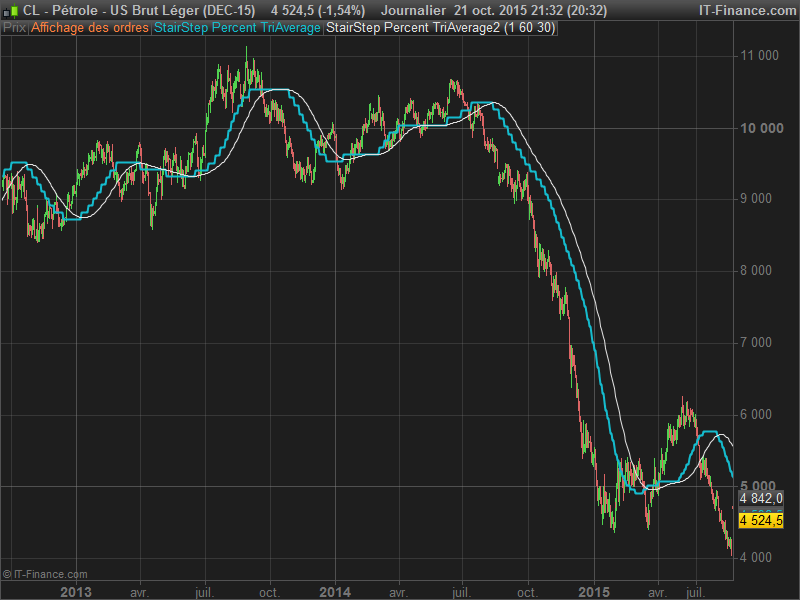
Another version of the “stair step” representation of price moving within percentage variation of the Triangular moving average to draw the steps.
I add another simple MA to act like a signal for trend following identification. When the 2 lines are flat, market is ranging.
I believe it can be easily take part of trend following strategy of all sort.
//parameters :
//percent = 1 (daily)
//period = 100 (daily timeframe period of the triangular moving average
//SignalPeriod = 30

once ssMA = close
MA = TriangularAverage[period](close)

if(MA > ssMA + (MA/100)*percent) THEN
   ssMA = MA
ELSIF (MA < ssMA - (MA/100)*percent) THEN
   ssMA = MA
ELSE
   ssMA = ssMA
ENDIF

signalLine = average[SignalPeriod](ssMA)

RETURN ssMA coloured(21,188,206), signalLine
Download
Filename:
trend-following.png
Downloads:
37
Download
Filename:
StairStep-Percent-TriAverage.itf
Downloads:
164
Master
I created ProRealCode because I believe in the power of shared knowledge. I spend my time coding new tools and helping members solve complex problems.
If you are stuck on a code or need a fresh perspective on a strategy, I am always willing to help. Welcome to the community!
Author’s Profile
Loading...