

Trend & Range // Indicator & Screener
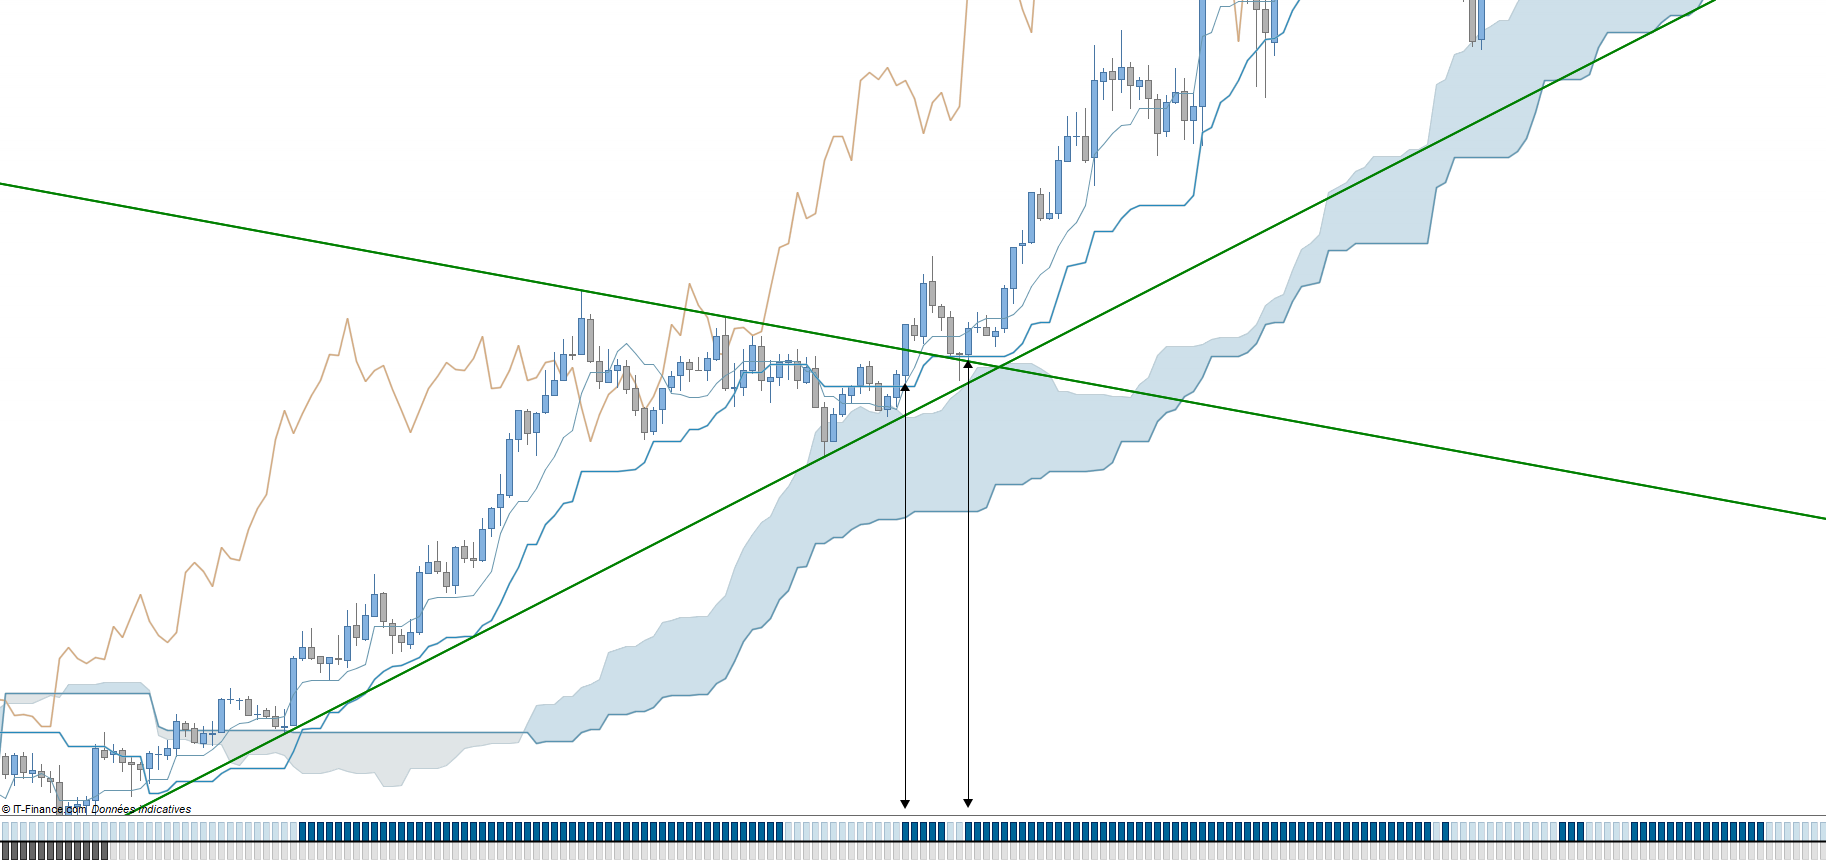
Ichimoku is not only a simple indicator, this one can be confronted with the technical analysis to show its reliability which for me completes the classic technical analysis and confirms the readable information
In this example, we can see that ichimoku gives a starting signal twice following the break of the bevel and following the pullback on the upper oblique.
On can then see the accuracy of this indicator on these base values 26/09/52
Ichimoku confirms a bullish trend when all lines are above each other and inversely for a bearish trend.
Chikou > price/components
Tenkan > Kijun/Cumo
Kijun > Cumo
SSA > SSB
When one of the parameters invalidates the trend, we enter an equilibrium phase. I have therefore developed this indicator which visually shows the confirmation of a trend.
This indicator does not provide signals, it confirms or denies the trend, it is up to you to choose the right moment, note however that it is more interesting to find an entry point on the beginning of a trend.
To be able to analyze several assets simultaneously, I have also developed a screener to show the markets in trend, I know that there are also range traders, so I have also developed a screener that for the range
Thanks Hosoda 😉